How to Build an Incident Response Agent with OpenClaw
IBM's 2025 Cost of a Data Breach report found organizations using AI and security automation saved $1.76M per breach compared to those without, and shortened the breach lifecycle by 108 days. Most on-call teams still rely on manual runbooks or heavyweight SOAR platforms that take months to integrate.

Why Manual Incident Response Breaks Down
Organizations using AI and security automation save $1.76M per breach compared to those without, and shorten the breach lifecycle by 108 days, according to IBM's 2025 Cost of a Data Breach report. That gap between automated and manual response is where most on-call teams still operate.
The typical incident workflow is sequential. A monitoring tool fires an alert. An on-call engineer wakes up, opens a laptop, and reads context. They SSH into affected systems, run diagnostic commands, and collect logs. Based on the output, they fix the issue or escalate. Someone writes a post-mortem the next day, often from memory.
Each step blocks on the previous one. The engineer is the single thread. If two incidents land simultaneously, one waits. Mandiant's 2025 analysis found the median alert-to-triage window sits between 30 and 60 minutes for most teams. Top-quartile teams in the SANS 2025 SOC survey compressed triage to 5 to 10 minutes, but they had dedicated automation in place.
SOAR platforms like Splunk SOAR and Palo Alto XSOAR automate parts of this pipeline. They work well for large security operations centers with dedicated playbook engineers. But they require months of integration, commercial licenses, and ongoing rule maintenance. A five-person DevOps team running Kubernetes does not need a full SOAR deployment to automate basic alert triage.
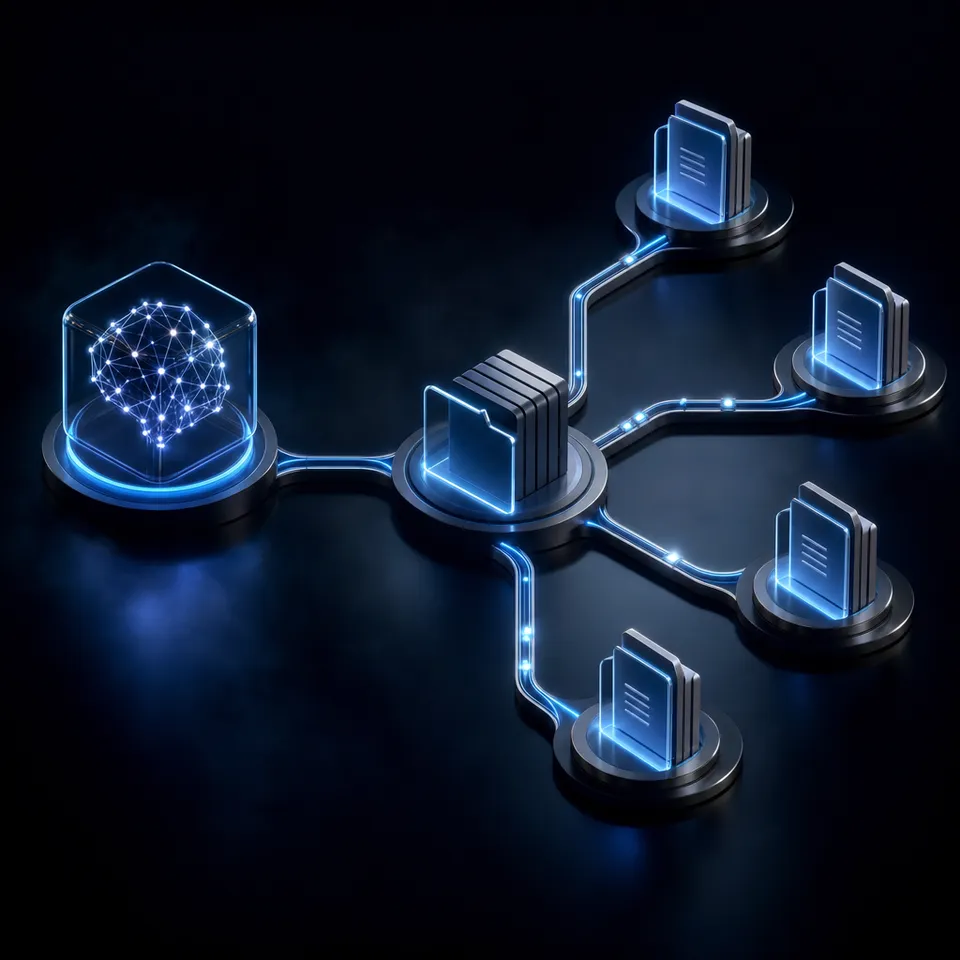
OpenClaw fills this gap. It is an open-source AI agent that crossed 135,000 GitHub stars within weeks of its early 2026 launch. It runs on your own infrastructure, connects to messaging platforms your team already uses (Slack, Telegram, Discord, WhatsApp), and can execute restricted commands, read files, and call APIs. Its heartbeat system checks in every 30 minutes, and its TaskFlow layer handles durable multi-step workflows that survive restarts. You can wire a monitoring automation hooks to OpenClaw and have an agent that triages alerts and collects diagnostics before the on-call engineer opens their laptop.
Related guides
- How to Build a Hermes Agent AI Code CheckerThe proportion of copy-pasted code in repositories rose from 8% in 2020 to 12% in 2024, representing a 48% relative...
- How to Build AI Agents with the Claude Agent SDKThe Claude Agent SDK is Anthropic's toolkit for building AI agents that can read files, run commands, search the web,...
- How to Build a Web Scraping Agent with OpenClawOpenClaw's browsing skill turns your AI agent into a web scraper that can navigate pages, handle JavaScript rendering,...
- Best OpenClaw Projects to Build: Beginner to Advanced Ideas for 2026OpenClaw crossed 250,000 GitHub stars faster than any software project in history, but most developers stall after the...
- How to Build a Personal AI Assistant with OpenClawOpenClaw crossed 350,000 GitHub stars in under five months, making it the most-starred software project on the...
- How to Build a Data Pipeline Agent with OpenClawTraditional ETL pipelines break when data sources change schemas, rotate auth tokens, or serve content behind...
More on this subject: OpenClaw Setup and Guides (199 guides)
How OpenClaw's Architecture Supports Incident Response
OpenClaw's automation stack has six mechanisms. Three of them map directly to incident response.
Hooks for Alert Intake
Hooks are event-driven HTTP endpoints that accept incoming webhooks. When a monitoring tool detects a problem, it sends a POST request to OpenClaw's hooks endpoint. The hook delivers the alert payload as a message to a designated agent session, creating a clean separation between detection and investigation.
Each automation hooks-triggered session gets its own isolated context, so concurrent incidents do not contaminate each other. The agent receives the alert, parses the payload, and decides what to do next based on severity rules defined in its system prompt or standing orders.
Heartbeat for Continuous Monitoring
The heartbeat runs a main-session turn every 30 minutes by default. During each cycle, the agent evaluates its task list, checks for pending work, and runs routine monitoring. If nothing needs attention, it returns a HEARTBEAT_OK signal that the gateway suppresses without notifying anyone.
For incident response, the heartbeat acts as a safety net. If a automation hooks delivery fails, the next heartbeat cycle catches queued alerts. It also handles follow-up work: checking that previous incidents were resolved, verifying that remediation steps held, and flagging recurring failures before they escalate.
TaskFlow for Multi-Step Orchestration
TaskFlow sits above individual background tasks. It manages durable multi-step workflows with persistent state and revision tracking. Progress survives gateway restarts, which matters when an investigation stretches across hours.
Two operational modes cover different patterns. Managed mode controls the full lifecycle: creating child tasks, driving completion, and advancing state. Mirrored mode observes externally triggered tasks without owning them, useful when independent diagnostic scripts form parts of a single investigation.
Flows support conditional execution, dependency chains between steps, and approval gates where a human reviews findings before the agent takes a high-impact action. Beyond these three mechanisms, OpenClaw provides standing orders for permanent operating authority, background tasks for tracking detached work, and cron jobs for time-based triggers. A production incident response agent typically combines hooks for real-time alerting, heartbeat for periodic health checks, and TaskFlow for multi-step investigation sequences.
Five Stages of an Automated Incident Response Pipeline
Building an incident response agent follows a five-stage pipeline. Each stage maps to specific OpenClaw capabilities.
1. Alert Intake via Webhooks
Configure your monitoring tool to send alerts to OpenClaw's hooks endpoint as HTTP POST requests. The alert message should include the service name, current status, and available diagnostic commands.
Message clarity matters more than payload completeness. A structured message that explicitly names the failed service and lists available diagnostic scripts produces better agent behavior than dumping raw monitoring JSON. If you use Uptime Kuma, for example, the custom automation hooks body can include the monitor name, status description, and the exact SSH command the agent should run first.
2. Severity Triage
The agent evaluates the alert against severity rules you define in standing orders or the system prompt. A basic rubric might classify P1 as complete customer-facing outages, P2 as degraded performance, and P3 as warnings that need investigation but not immediate escalation.
OpenClaw's persistent memory helps here. An agent that has investigated three previous outages for the same service will recognize patterns and adjust its triage. If the last two Nginx failures were caused by certificate expiration, the agent checks certificates first this time.
3. Diagnostic Log Retrieval
This stage collects the data the agent needs to identify root cause. The recommended pattern, documented in community implementation guides, uses restricted SSH access with pre-approved diagnostic scripts.
The approach works in three layers:
- Generate a dedicated SSH key (Ed25519, no passphrase) for automated access
- Restrict that key on the target host to a single dispatcher script using SSH authorized_keys directives that disable forwarding, force a specific command, and limit source IPs
- Write deterministic scripts that collect specific system data: uptime, memory and disk usage, container status, and recent kernel logs including OOM events
The agent never gets arbitrary shell access. It can only invoke named scripts through the dispatcher. Each script outputs timestamped, labeled sections that the LLM parses consistently across runs. One important detail from real implementations: OOM kill events appear in host kernel logs, not container journals. Your diagnostic scripts should check host-level dmesg even when investigating container failures.
4. Runbook Execution via TaskFlow
For incidents requiring multiple investigation steps, TaskFlow orchestrates the sequence. A flow definition describes each step, its dependencies, and where humans need to approve:
name: incident-triage
steps:
  - id: collect-diagnostics
    command: run-host-diagnostics
  - id: analyze-findings
    command: triage-analyze --json
    stdin: $collect-diagnostics.json
  - id: escalation-review
    command: prepare-notification --preview
    stdin: $analyze-findings.json
    approval: required
  - id: notify-oncall
    command: send-notification --execute
    stdin: $analyze-findings.json
    condition: $escalation-review.approved
The approval gate before notification ensures a human reviews the agent's analysis before messages reach on-call responders or customers. Automated data collection and analysis are safe to run autonomously. Customer-facing communication is not.
TaskFlow's durability means an investigation that spans hours, waiting for a human to approve escalation during off-hours for example, will not lose state if the gateway restarts.
5. Post-Mortem Generation and Handoff
After resolution, the agent compiles its findings into a structured post-mortem. The report includes the event timeline, diagnostic data collected at each stage, root cause analysis, and preventive recommendations. Because the agent processed structured diagnostic output throughout, the post-mortem draws from actual data rather than someone's next-day recollection.
This is where file storage matters. Diagnostic logs, agent reasoning traces, and the final report need a shared location the rest of the team can access, search, and reference when the same service fails six months later.


Centralize Your Incident Artifacts in One Searchable Workspace
Store diagnostic logs, post-mortem reports, and runbook outputs where agents and your team can search them by meaning. Version history, audit trails, and an MCP server for agent-driven file operations come standard.
Securing the Agent Pipeline for Production
An AI agent with SSH access to production systems requires careful guardrails. The principle is defense in depth: no single failure should give the agent unrestricted access.
SSH Access Restrictions
The restricted SSH key pattern provides three layers of protection. The restrict directive in authorized_keys disables port forwarding, agent forwarding, X11 forwarding, and PTY allocation. The command= directive forces every SSH session through a single dispatcher script, regardless of what command the client requests. The from= directive limits connections to a specific IP address.
The dispatcher script adds a fourth layer. It auto-discovers diagnostic scripts by naming convention, blocks any arguments to prevent injection, and routes only to pre-approved executables. If someone compromises the SSH key, they can run diagnostics but nothing else.
Exec Tool Allowlisting
OpenClaw supports tool-level execution controls. You can configure the exec tool to use an allowlist of approved binaries, restricting what the agent can run on its local host. Common safe binaries like grep, head, tail, and sort handle text processing without risk. The SSH binary needs explicit per-agent approval rather than a global wildcard, preventing automation hooks sessions from inheriting permissions they should not have.
Session Isolation and Approval Gates
automation hooks-triggered sessions run in separate contexts from interactive conversations. This prevents an incident investigation from contaminating the agent's main session and keeps the audit trail for each incident self-contained.
TaskFlow's approval gates add a final check. High-impact actions like restarting services, notifying customers, or modifying infrastructure configs require human sign-off. The agent collects data and recommends actions. A human makes the call on anything with blast radius.
Storing Incident Artifacts in Shared Workspaces
The post-mortem is only useful if people can find it six months later when the same service fails. Most incident response setups scatter artifacts across Slack threads, terminal scrollback, and someone's local notes directory.
Dedicated storage solves the persistence problem, but not all storage works equally well for incident data. Local files disappear when sessions end or machines are reimaged. S3 buckets persist reliably but offer no search beyond filename patterns. Google Drive stores documents but has no agent-native integration for automated uploads.
Fast.io provides shared workspaces where agents and humans operate on the same files. An OpenClaw agent can write diagnostic logs and post-mortem reports to a Fast.io workspace through the MCP server, making them immediately available to the engineering team.
Three capabilities make this particularly useful for incident response:
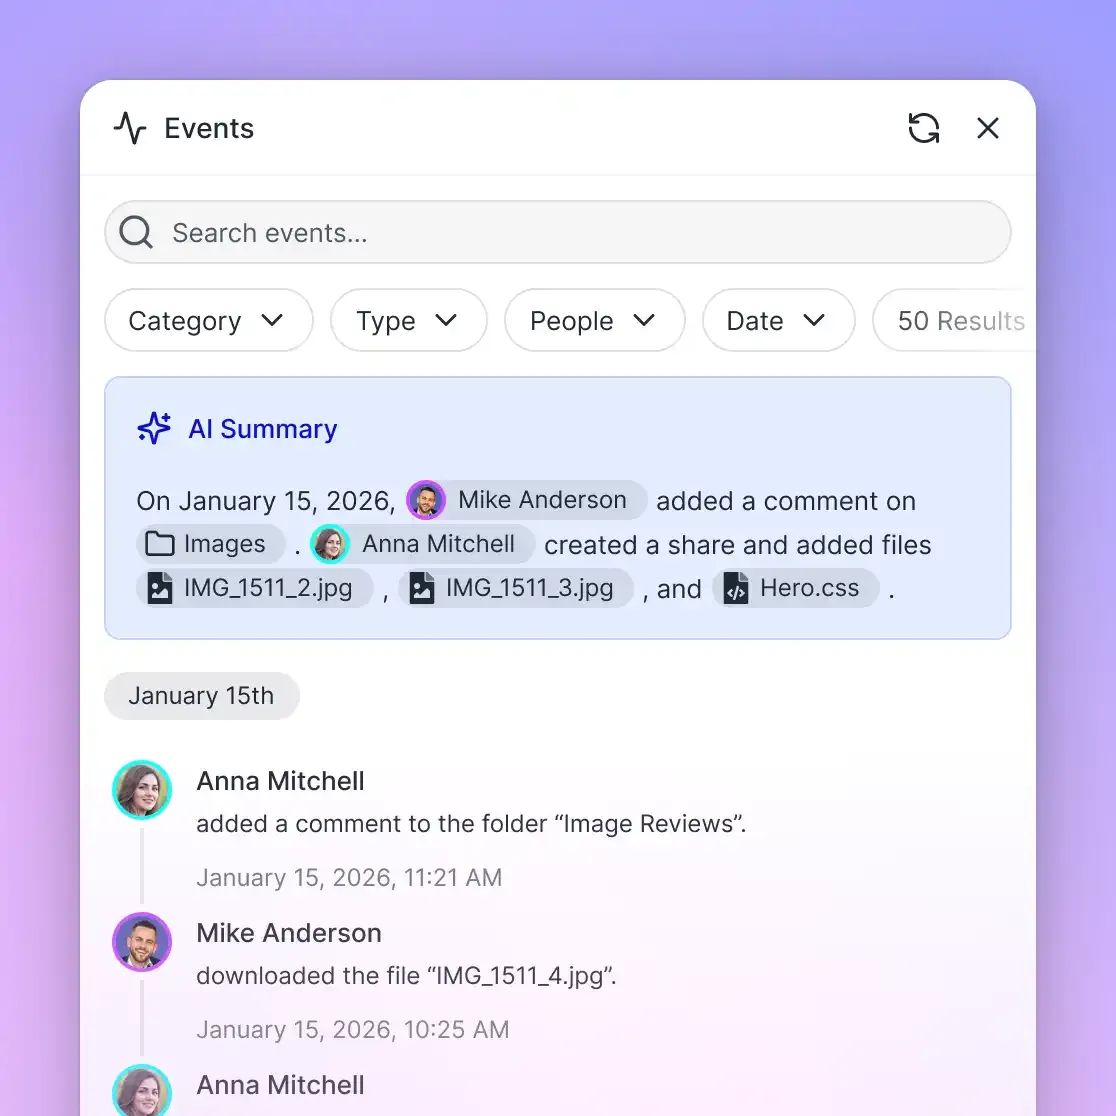
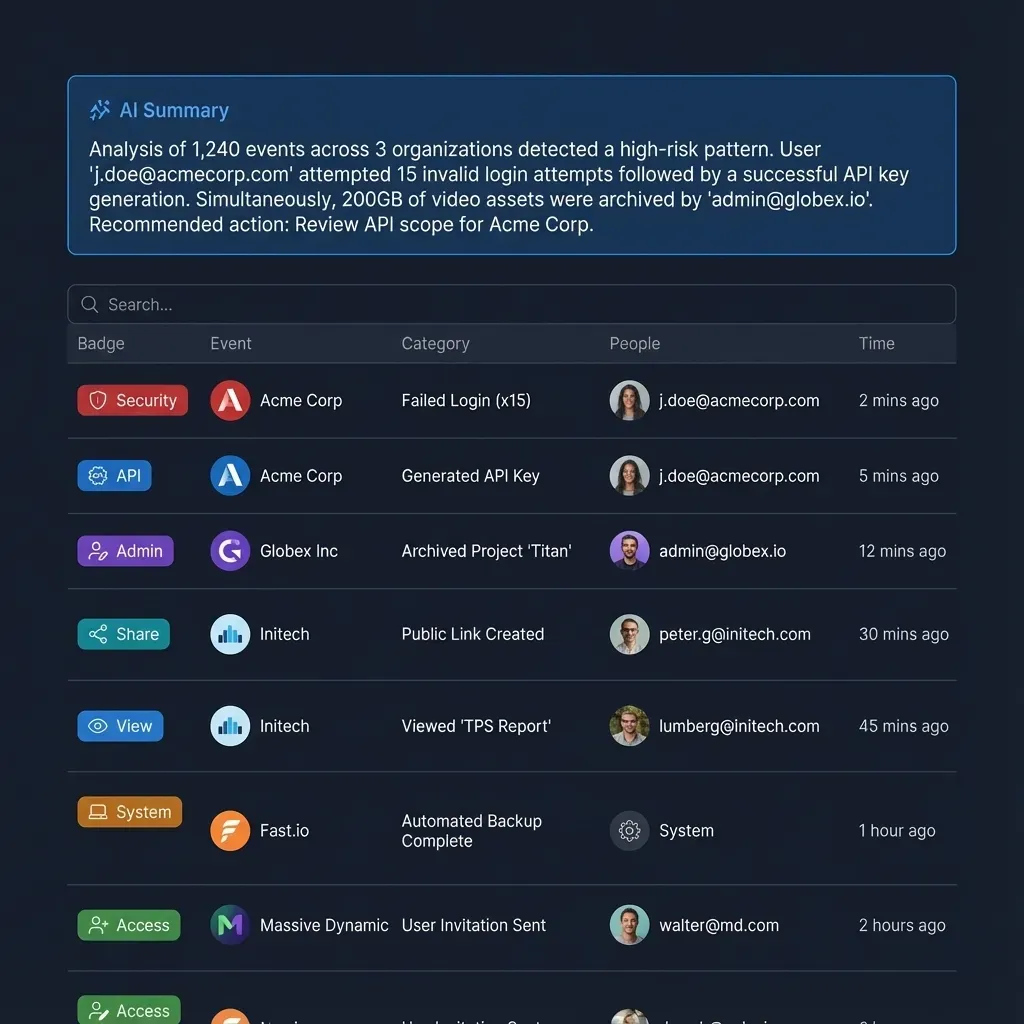
- Intelligence Mode auto-indexes uploaded files for semantic search. Six months from now, an engineer can search "what caused the payment service outage in January" and get answers with citations from the stored post-mortem, instead of grep-ing through filenames
- Audit trails record every file operation with timestamps and actor identity, providing compliance-grade documentation of what the agent collected and when
- Ownership transfer lets the agent create and populate a workspace, then hand administrative control to a team lead. The agent retains contributor access for future incidents, but the human owns the record
The workflow is straightforward. The agent writes each diagnostic report to a workspace folder organized by date and service name. Intelligence Mode indexes the content automatically. When the next incident hits the same service, the agent queries past incidents through Fast.io's built-in RAG capabilities to check whether this is a known failure pattern before starting a fresh investigation.
Sources
References used to verify factual claims in this guide.
-
Organizations using AI and security automation save $1.76M per breach and shorten the breach lifecycle by 108 days
- 2 UnderDefense Incident Response Automation Guide, citing Mandiant 2025 and SANS 2025 SOC Survey Accessed
Median alert-to-triage window of 30 to 60 minutes; top-quartile teams compress triage to 5 to 10 minutes
-
OpenClaw accumulated over 135,000 GitHub stars within weeks of launch
Frequently Asked Questions
How do you automate incident response with AI agents?
Connect a monitoring tool to an AI agent via webhooks. The agent receives alerts, evaluates severity against predefined rules, runs restricted diagnostic commands to collect system data, and posts findings to your team's messaging channel. Use an orchestration layer like OpenClaw's TaskFlow to chain multiple investigation steps with approval gates for high-impact actions like service restarts or customer notifications.
Can OpenClaw monitor server alerts?
OpenClaw does not replace dedicated monitoring tools like Uptime Kuma, Datadog, or Prometheus. It receives alerts from those tools via its hooks endpoint and acts on them. The heartbeat system also runs every 30 minutes to catch queued alerts or follow up on previous incidents, providing a safety net alongside automation hooks-driven alerting.
How do you build an on-call automation agent?
Enable OpenClaw's hooks to receive webhooks from your monitoring stack. Set up restricted SSH access using key-based authentication with command restrictions, limiting the agent to pre-approved diagnostic scripts. Define severity triage rules in standing orders. Use TaskFlow to orchestrate multi-step investigation workflows, and place approval gates before any action that affects customers or production state.
What is an AI incident response agent?
An AI incident response agent automates parts of the incident management lifecycle: monitoring alert channels, classifying severity, collecting diagnostic data from affected systems, following runbook steps, and generating post-mortem reports. Unlike SOAR platforms that require extensive playbook engineering, an agent like OpenClaw reasons about unstructured alert data and adapts its investigation based on what the diagnostics reveal.
Where should you store incident response artifacts?
Incident artifacts, including diagnostic logs, post-mortem reports, and runbook traces, belong in a shared workspace the team can search by content rather than filename. Fast.io workspaces with Intelligence Mode provide semantic search across past incidents. An agent writes files via MCP, the workspace indexes them automatically, and engineers can query past incidents in natural language months later.
Related Resources

Centralize Your Incident Artifacts in One Searchable Workspace
Store diagnostic logs, post-mortem reports, and runbook outputs where agents and your team can search them by meaning. Version history, audit trails, and an MCP server for agent-driven file operations come standard.