How to Automate Grafana Dashboards with an OpenClaw Agent
Grafana Lens is an open-source OpenClaw plugin with 18 composable tools that turn natural language into PromQL queries, automated dashboards, and alert rules across your LGTM stack. Instead of switching between tabs and writing queries from memory, an OpenClaw agent handles metric exploration, anomaly detection, and incident reporting in a single conversation.

Alert Fatigue and the Missing Automation Layer
Grafana Labs' 2026 Observability Survey, covering 1,363 respondents across 76 countries, found that 30% of teams cite alert fatigue as their single biggest obstacle to faster incident response. The alerts fire, the dashboards exist, and the telemetry data is all there. But correlating signals across Prometheus, Loki, and Tempo, writing the PromQL to confirm a hypothesis, and documenting what happened before the next page arrives takes time that most on-call engineers don't have.
Grafana Lens is an open-source OpenClaw plugin that addresses this directly. It exposes 18 composable tools your agent can call to query metrics, create dashboards, manage alert rules, investigate multi-signal anomalies, and render chart snapshots for sharing. The agent handles the repetitive cycle of querying, investigating, and documenting while the engineer focuses on decisions that require human judgment.
The SRE workflow this guide builds works end to end: your OpenClaw agent monitors a Grafana instance, flags an anomaly using z-score analysis against 7-day baselines, correlates metrics and logs to narrow the root cause, generates a dashboard snapshot, and stores investigation artifacts in a shared workspace where your team can review them without digging through chat transcripts.
Before Grafana Lens, automating even basic dashboard creation through Grafana's HTTP API meant writing custom scripts, managing authentication tokens, and handling JSON dashboard models that run hundreds of lines. The plugin abstracts that into natural language. Ask your agent to build a dashboard tracking API latency by endpoint, and it selects the right template, writes the PromQL, and provisions the panels.
The same survey found that 92% of respondents see value in AI surfacing anomalies before downtime. Grafana Lens is the implementation of that idea for teams already running an LGTM stack with OpenClaw.
Related guides
- How to Automate Perplexity Personal Computer with ZapierPerplexity Personal Computer gives you an always-on AI research agent that runs continuously on your behalf. Zapier...
- How to Automate Web Scraping With Hermes Agent's Scrapling SkillHermes Agent's Scrapling skill gives your AI agent three distinct scraping strategies, from fast HTTP fetching for...
- How to Connect OpenClaw to Datadog for AI Agent MonitoringDatadog's free LLM Observability tier gives you 40,000 spans per month to trace OpenClaw agent behavior, but most teams...
- How to Automate Email Workflows with OpenClaw AgentsOpenClaw agents can monitor inboxes, classify messages, extract data from attachments, and route actions through...
- How to Automate OpenClaw Workflows with Zapier MCPOpenClaw agents are good at reasoning, but they need a way to act on that reasoning across your existing tools. Zapier...
- How to Automate Airtable with OpenClawOpenClaw can read, write, and manage Airtable records through natural language commands, replacing manual Zapier and...
More on this subject: OpenClaw Setup and Guides (199 guides)
The 18 Grafana Lens Tools by Category
Grafana Lens organizes its tools into four groups. Each tool maps to a specific Grafana API operation, so the agent knows exactly which capability to invoke for a given request.
Query and Exploration
Six tools handle metric discovery and data retrieval:
- grafana_explore_datasources discovers all configured datasources in your Grafana instance.
- grafana_list_metrics finds available metrics with metadata like type, help text, and labels.
- grafana_query runs PromQL instant or range queries against any Prometheus datasource.
- grafana_query_logs executes LogQL queries against Loki for log search and aggregation.
- grafana_query_traces searches distributed traces in Tempo using TraceQL.
- grafana_explain_metric returns context, trend analysis, statistical summaries, and anomaly z-scores for any individual metric.
Dashboard Management
Five tools cover the full dashboard lifecycle:
- grafana_create_dashboard builds new dashboards from 12 pre-built templates or custom JSON panel definitions. Templates include LLM Command Center, Cost Intelligence, SRE Operations, Security Overview, and eight others, all with template variables pre-wired.
- grafana_update_dashboard adds, removes, or modifies panels on existing dashboards without recreating them.
- grafana_get_dashboard retrieves a dashboard summary with a health audit of every panel, checking for broken queries and datasource connectivity issues.
- grafana_search finds dashboards by title, tags, or starred status.
- grafana_share_dashboard renders individual panels as PNG images for delivery to Slack, Telegram, Discord, and 15 other messaging channels.
Alerting and Monitoring
Three tools manage the alert lifecycle:
- grafana_create_alert creates Grafana-native alert rules from plain English descriptions. The agent translates conditions into PromQL and sets evaluation intervals.
- grafana_check_alerts lists active alerts, acknowledges or silences them, and manages alert rule lifecycle operations.
- grafana_annotate creates and queries time-based event annotations on dashboards, useful for marking deployment windows and incident timelines.
Data and Security
Four tools handle data ingestion, security audits, and incident investigation:
- grafana_push_metrics pushes custom data points (calendar events, git commit counts, build times, financial data) into Prometheus via OTLP.
- grafana_security_check runs six parallel security checks and outputs a threat-level report covering prompt injection signals, cost anomalies, tool loops, session enumeration, automation hooks error ratios, and stuck sessions.
- grafana_investigate performs multi-signal triage with hypothesis generation, correlating metrics, logs, and traces to rank probable root causes.
- alloy_pipeline manages Grafana Alloy data collection pipelines with 29 pre-built recipes across metrics, logs, traces, infrastructure, and profiling categories.
The investigation tool deserves extra attention. It scores anomalies by computing z-scores against 7-day metric baselines, then compares the current pattern against seasonal trends to separate genuine incidents from predictable load spikes. Alert fatigue drops when your agent can tell you "this CPU spike matches your typical Monday morning batch job" instead of paging you at 3 AM.
How to Install Grafana Lens on OpenClaw
You need three things before starting: a running OpenClaw instance, Docker (recommended) or an existing Grafana deployment, and a Grafana service account token with Editor-level permissions.
Standing Up a Local LGTM Stack
If you don't already have Grafana running, the fast path is Grafana's official LGTM Docker image. It bundles Loki, Grafana, Tempo, and Mimir in a single container. Pull the grafana/otel-lgtm image from Docker Hub, expose ports for Grafana (3000), OTLP gRPC (4317), OTLP HTTP (4318), and Prometheus (9090), and you have a full observability stack in under a minute. Check the Grafana docs for the current default credentials and change them before exposing the instance to any network.
Creating a Service Account Token
Open Grafana at localhost:3000 and navigate to Administration, then Service Accounts. Create a new account with the Editor role, then generate a token. The token starts with glsa_ and is the only credential Grafana Lens needs.
Installing the Plugin
Install the Grafana Lens plugin through the OpenClaw plugin manager and restart the gateway so the new tools are registered. The Grafana Lens README has the current install command and any version-specific flags.
Configuring the Connection
The minimal setup uses two environment variables:
export GRAFANA_URL=http://localhost:3000
export GRAFANA_SERVICE_ACCOUNT_TOKEN=glsa_xxxxxxxxxxxx
For production deployments, configure the plugin in your OpenClaw config file at ~/.openclaw/openclaw.json. This lets you set the OTLP endpoint for telemetry export, enable Alloy pipeline management, and control content redaction for traces:
{
  "plugins": {
    "entries": {
      "openclaw-grafana-lens": {
        "enabled": true.
        "config": {
          "grafana": {
            "url": "http://localhost:3000",
            "apiKey": "glsa_xxxxxxxxxxxx"
          },
          "otlp": {
            "endpoint": "http://localhost:4318/v1/metrics",
            "logs": true.
            "traces": true.
            "redactSecrets": true
          }
        }
      }
    }
  }
}
Once configured, restart the gateway with openclaw gateway restart. The agent now has access to all 18 tools and lists them when you ask what it can do with Grafana.


Store your agent's incident reports where the whole team can search them
Fastio gives your OpenClaw agent a persistent workspace with semantic search across every investigation artifact, with a remote MCP endpoint ready for uploads.
Automating Dashboards and the Full Incident Lifecycle
With the plugin installed, the practical workflow splits into three phases: building dashboards, detecting anomalies, and investigating incidents.
Creating Dashboards Through Conversation
Grafana Lens ships with 12 pre-built dashboard templates: LLM Command Center, Cost Intelligence, Session Explorer, Tool Performance, SRE Operations, Security Overview, GenAI Observability, Node Exporter, HTTP Service, Metric Explorer, Multi-KPI, and Weekly Review. Ask the agent to create any of these and it provisions the dashboard with template variables already configured.
Custom dashboards work the same way. Describe the panels you want, the metrics they should display, and the time range. The agent calls grafana_create_dashboard with the appropriate panel configuration and PromQL expressions. When you need to adjust a panel later, grafana_update_dashboard modifies it in place without recreating the whole dashboard.
For teams running multiple services, start with the HTTP Service template. It covers request rate, error rate, and latency percentiles out of the box. The agent can then layer on custom panels for business metrics you push via grafana_push_metrics, like deployment frequency or feature flag rollout counts.
Detecting Anomalies Automatically
The grafana_explain_metric tool does more than describe a metric. It computes a z-score against a 7-day rolling baseline and compares the current value against seasonal patterns from the same day and time in previous weeks. A z-score above 2.0 flags the metric as anomalous. A z-score above 3.0 signals a strong deviation worth investigating.
Set up a recurring check by asking the agent to explain key metrics on a schedule. When it spots a deviation that crosses your threshold, it can automatically call grafana_investigate to begin multi-signal correlation without waiting for a human to notice the alert.
Multi-Signal Investigation
The investigation tool pulls related metrics from Prometheus, error logs from Loki, and slow traces from Tempo. It generates hypotheses based on the correlated signals and ranks them by likelihood.
A typical investigation looks like this: the agent detects elevated error rates on a specific endpoint, queries Loki for error logs from that service during the same window, pulls Tempo traces showing high latency in a downstream dependency, and summarizes the findings with a ranked list of probable causes. It can then annotate the affected dashboards to mark the incident window and render snapshot PNGs of the relevant panels for the team to review.
Running Security Checks
The grafana_security_check tool runs six parallel checks covering automation hooks error ratios, cost anomalies, tool loop detection, prompt injection signals, session enumeration attempts, and stuck session identification. Each check returns a green, yellow, or red threat level based on configurable thresholds. A red result on any check means the agent should escalate to a human immediately, with the rendered evidence attached.
How to Store and Share Investigation Artifacts
An incident investigation produces several artifacts: dashboard snapshots, log excerpts, trace summaries, and a written root-cause analysis. Where these end up after the agent finishes determines whether the next person can actually learn from the investigation or has to start from scratch.
The simplest option is a local directory or git repository. The agent writes markdown files and PNG snapshots to disk, and you commit them alongside your runbooks. This works for solo operators but breaks down when multiple team members need to search across incidents from the past quarter.
Object storage like S3 or GCS handles durability but adds setup overhead: bucket policies, IAM credentials, and a separate search layer. For incident reports that each get read a handful of times, the infrastructure cost usually isn't justified.
A shared workspace built for agent output fits this workflow more naturally. Fastio provides workspaces where agents upload files, organize them by incident or service, and hand them off to human reviewers. The Fastio MCP server gives agents tools for uploading, organizing, and searching workspace contents, so your OpenClaw agent can store artifacts without leaving the conversation thread.
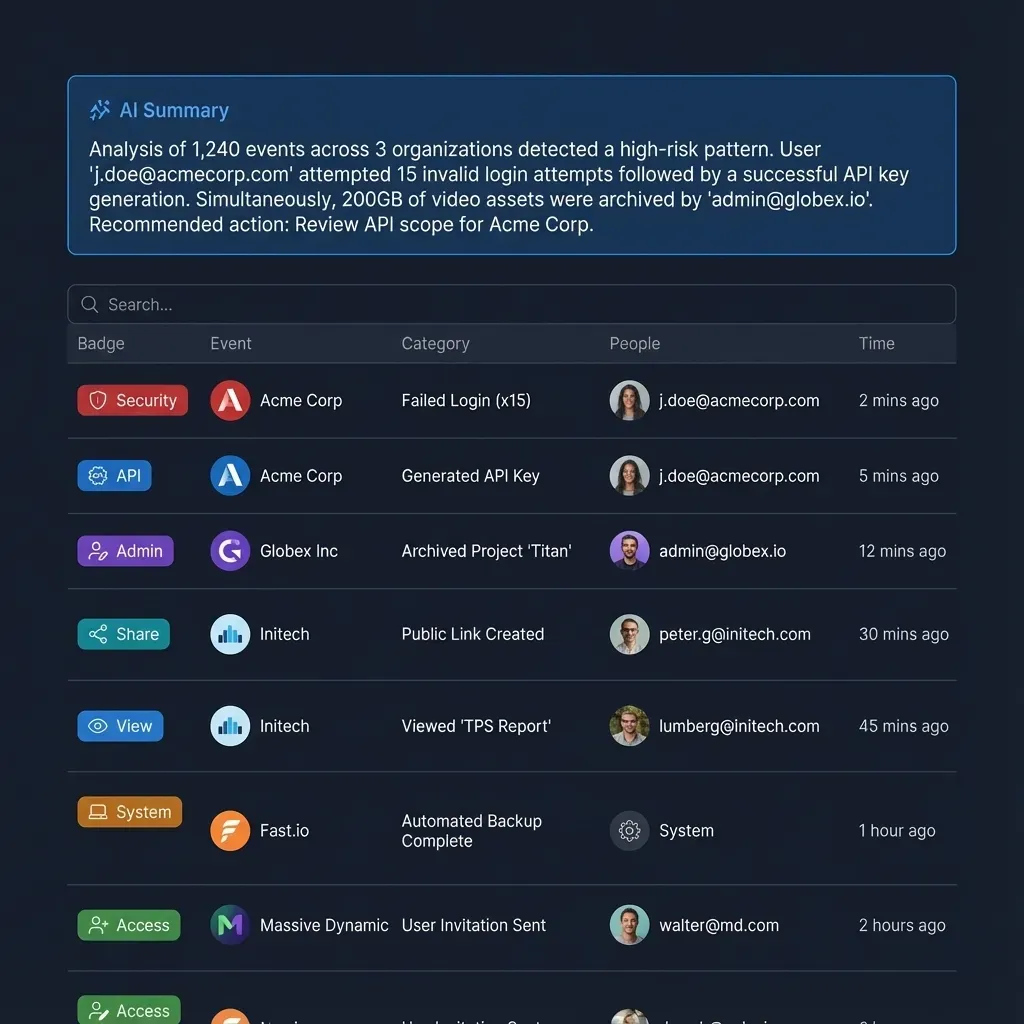
The practical setup: create a workspace for incident reports, enable Intelligence Mode so contents are automatically indexed for semantic search, and configure the agent to upload investigation summaries after each triage. When a team lead needs to review last week's P1 incidents, they search by service name or error type rather than scrolling through Slack threads or grepping a shared drive. Intelligence Mode returns results with citations pointing to the specific report section that matched.
For teams that want the OpenClaw agent to handle the full loop, the Fastio OpenClaw integration lets you connect workspace operations directly. The agent creates an incident folder, uploads the dashboard snapshot, writes the investigation summary, and shares a link with the on-call channel.
Fastio offers an official 14-day Business Trial (credit card required), and plans start at $9.99/mo for Starter with 250 GB of storage and 100,000 credits per month. For an SRE team storing investigation artifacts, that provides ample capacity. Sign up at fast.io/pricing or connect your agent to the remote MCP endpoint.
Sources
References used to verify factual claims in this guide.
-
30% of teams cite alert fatigue as the biggest obstacle to faster incident response 92% of teams see value in AI helping surface anomalies before downtime
-
18 composable tools in the Grafana Lens plugin 12 pre-built dashboard templates with template variables
Frequently Asked Questions
How do I connect OpenClaw to Grafana?
Install the Grafana Lens plugin through the OpenClaw plugin manager, set the GRAFANA_URL and GRAFANA_SERVICE_ACCOUNT_TOKEN environment variables, and restart the gateway. Check the Grafana Lens README for the current install command. Your agent gains access to all 18 Grafana tools immediately. The service account token needs Editor-level permissions.
What is Grafana Lens for OpenClaw?
Grafana Lens is an open-source plugin that gives OpenClaw agents 18 composable tools for interacting with a Grafana stack. The tools cover metric and log queries, distributed trace search, dashboard creation and modification, alert rule management, security auditing, anomaly investigation, custom data ingestion via OTLP, and Alloy pipeline management.
Can an AI agent create Grafana dashboards?
Yes. With Grafana Lens installed, an OpenClaw agent creates dashboards from 12 pre-built templates or from a natural language description of the panels you want. The agent generates the PromQL expressions and panel configuration, provisions the dashboard in Grafana, and updates or adds panels through follow-up conversation without requiring you to touch the Grafana UI.
How do I use natural language to query Prometheus with AI?
Grafana Lens translates plain English questions into PromQL queries. Ask your OpenClaw agent something like 'show me the 95th percentile request latency for the payments service over the last 6 hours' and it calls the grafana_query tool with the correct PromQL. Results come back in the conversation with values, timestamps, and optional chart rendering.
What datasources does Grafana Lens support?
Grafana Lens queries any Prometheus-compatible datasource for metrics, Loki for logs, and Tempo for distributed traces. It works with whatever datasources are already configured in your Grafana instance, including remote Prometheus endpoints and cloud-hosted Grafana stacks.
How does Grafana Lens detect anomalies?
The grafana_explain_metric tool computes a z-score for any metric against a 7-day rolling baseline and compares the current pattern against seasonal trends from the same day and hour in prior weeks. Z-scores above 2.0 flag the metric as anomalous. The agent can then trigger a multi-signal investigation that correlates metrics, logs, and traces to generate ranked root-cause hypotheses.
Related Resources

Store your agent's incident reports where the whole team can search them
Fastio gives your OpenClaw agent a persistent workspace with semantic search across every investigation artifact, with a remote MCP endpoint ready for uploads.