How to Connect OpenClaw to Datadog for AI Agent Monitoring
Datadog's free LLM Observability tier gives you 40,000 spans per month to trace OpenClaw agent behavior, but most teams stop there and miss the other direction: letting agents query Datadog back. This guide covers both sides of the OpenClaw Datadog integration, from instrumenting your agents with telemetry to giving them MCP-based access to your monitoring data, with a shared workspace layer for persisting the reports that come out of each direction.


Why OpenClaw Datadog Integration Runs in Two Directions
Datadog's LLM Observability product bills only on LLM spans, while tool, embedding, retrieval, and agent spans cost nothing. That pricing model means you can instrument a complex multi-step OpenClaw agent and only pay for the actual model calls, not the orchestration around them. At the free tier, that is 40,000 LLM spans per month before you spend a dollar.
Most monitoring setups stop at "Datadog watches the agent." But the OpenClaw Datadog integration is genuinely bidirectional. In one direction, Datadog traces your OpenClaw agents the same way it traces any distributed system: latency per step, token costs, error rates, and hallucination detection. In the other direction, OpenClaw agents query Datadog through MCP tools, pulling monitors, metrics, logs, APM traces, and incident data using natural language commands.
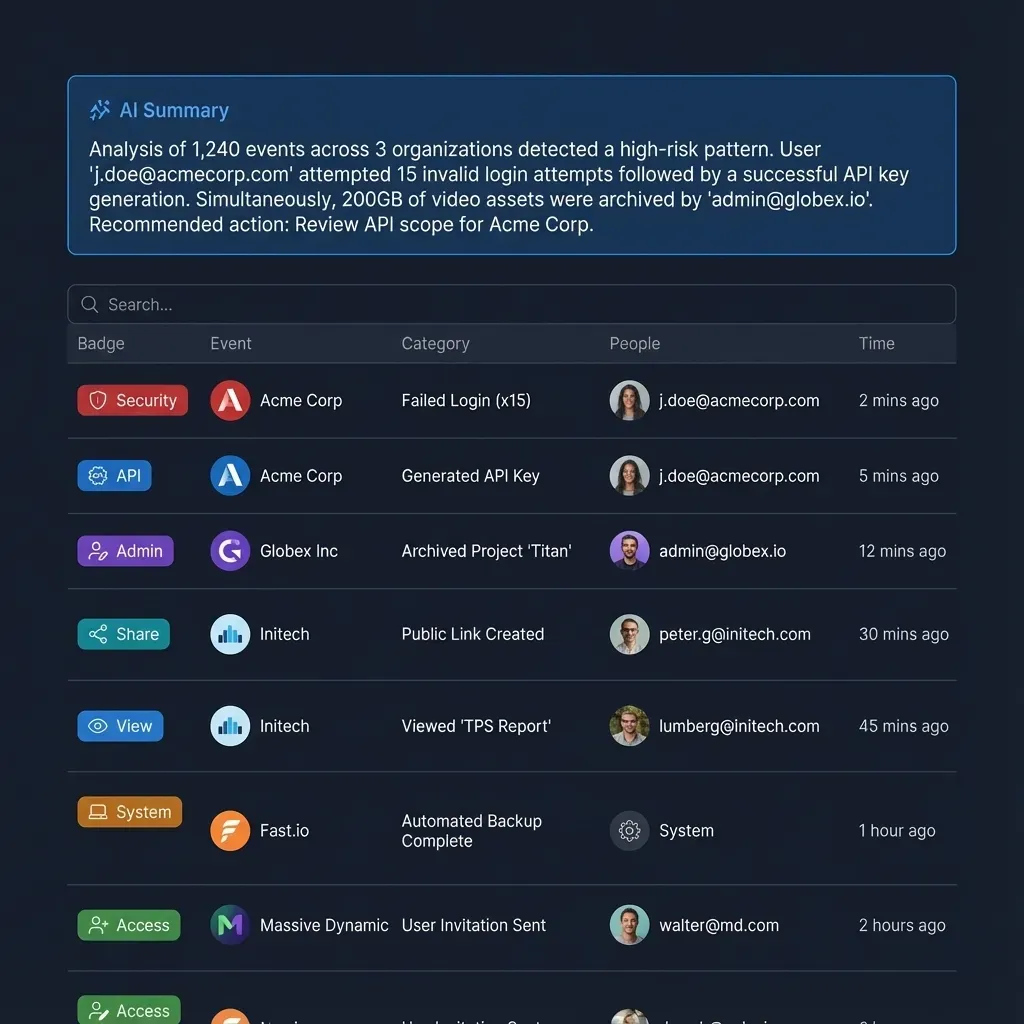
That second direction is where things get interesting for operations teams. An OpenClaw agent that can read your Datadog dashboards, check monitor status, and pull recent incidents can serve as a first-responder that triages alerts, summarizes log patterns, and drafts incident reports before a human even opens a browser tab.
The gap most articles miss is what happens to the output. Agent-generated monitoring reports, triage summaries, and dashboard snapshots need a home where both the agent and the team can access them. Local filesystems vanish between sessions. Email threads bury attachments. A shared workspace gives both sides persistent, searchable access to the same artifacts.
Related guides
- How to Connect Hermes Agent to n8n With Webhooksn8n has 400+ integrations but every workflow follows a predetermined path. Hermes Agent adds reasoning to those...
- How to Connect Devin AI to GitHubDevin AI's GitHub integration is a full GitHub App install with nine read scopes and eight read-write scopes, not a...
- How to Automate Grafana Dashboards with an OpenClaw AgentGrafana Lens is an open-source OpenClaw plugin with 18 composable tools that turn natural language into PromQL queries,...
- How to Connect Tavily Search to Your OpenClaw AgentTavily is an AI-native search API that returns structured results instead of raw HTML, and it ships as one of nine...
- How to Connect OpenClaw to Linear for AI-Powered Issue ManagementOpenClaw connects directly to Linear's GraphQL API, giving your AI agent the ability to triage issues, plan cycles, and...
- How to Connect OpenClaw to LM Studio for Local LLM AgentsOpenClaw's default preload behavior conflicts with LM Studio's JIT model loading, causing models to stay permanently...
More on this subject: OpenClaw Setup and Guides (199 guides)
How to Instrument OpenClaw Agents for Datadog Traces
Datadog treats every agent request like a distributed trace. Each request generates a trace containing spans for LLM calls, tool invocations, retrieval steps, and agent decisions. The platform provides out-of-the-box evaluators for hallucination detection and drift, automatic sensitive data scanning, and prompt injection detection.
The instrumentation options depend on your stack:
Python SDK (ddtrace): The most common path. Datadog's Python library auto-instruments calls to OpenAI, Anthropic, AWS Bedrock, and frameworks like LangChain and CrewAI. You add a few lines of initialization code and the SDK captures latency, errors, token usage, and cost at every step.
OpenTelemetry: OpenClaw v2026.2 and later includes built-in OpenTelemetry support. The community-maintained observability plugin by Henrik Rexed captures token usage metrics, model call spans with GenAI semantic conventions, individual tool execution spans with timing, and session lifecycle tracking with duration and request counts. The plugin exports OTLP data to any compatible backend, including Datadog's OTLP intake endpoint.
HTTP API: For setups where SDK integration is not practical, Datadog accepts trace data via a language-agnostic HTTP API. This works well when OpenClaw runs behind a gateway or proxy that handles telemetry collection.
Plugin configuration matters. If you install an observability plugin and see no trace data in Datadog, check your OpenClaw plugin settings. Community plugins typically require explicit permission to access conversation events before they can emit spans. The plugin's own documentation specifies the exact flags, but the symptom is always the same: the plugin loads without errors yet never sends telemetry.
Querying Datadog from OpenClaw via MCP
The other half of the OpenClaw Datadog integration lets your agents read from Datadog instead of just being observed by it. Two community-maintained approaches handle this today.
Composio MCP Integration
Composio provides a managed MCP server that registers Datadog tools directly into the OpenClaw agent. The integration exposes over 40 tools covering monitors, dashboards, infrastructure hosts, metrics, logs, traces, events, incidents, synthetic tests, and SLOs. Composio manages OAuth, API keys, and token refresh, so you configure authentication once and the agent handles the rest through natural language.
The practical workflow: authenticate your Datadog account through Composio's dashboard, add the Composio MCP endpoint to your OpenClaw configuration, and restart the gateway. From there, the agent can create and query monitors, pull host metrics with tags, search logs with filters, retrieve service dependency maps from APM, list synthetic test results, and manage SLOs. Composio's integration documentation covers the exact connection steps for each OpenClaw version.
ClawHub Datadog Skill
The ClawHub marketplace hosts a community Datadog observability skill that covers logs, metrics, APM traces, RUM events, incidents, and monitors. This is a lighter-weight option focused on read access for debugging, performance tuning, and incident response. Install it through ClawHub the same way you would any other skill.
Both approaches give agents the ability to answer questions like "what triggered the last PagerDuty alert?" or "show me p99 latency for the checkout service over the past hour" without a human opening the Datadog UI.


Persist your agent monitoring reports across sessions
Upload Datadog triage summaries, cost reports, and incident analyses to a shared workspace. generous storage, MCP-ready endpoint for your OpenClaw agents.
Storing Monitoring Artifacts in Shared Workspaces
Agent-generated monitoring reports have a shelf-life problem. An incident triage summary is useful for 48 hours. A weekly latency report matters for the sprint review. A capacity planning analysis feeds into next quarter's infrastructure budget. None of these belong in a Slack thread or a local /tmp directory.
Local storage is the default for most OpenClaw setups, but it disappears between sessions. S3 solves persistence but not discoverability: good luck finding last Tuesday's incident report in a flat bucket with 10,000 objects. Google Drive works for humans but agents struggle with OAuth flows and folder hierarchies.
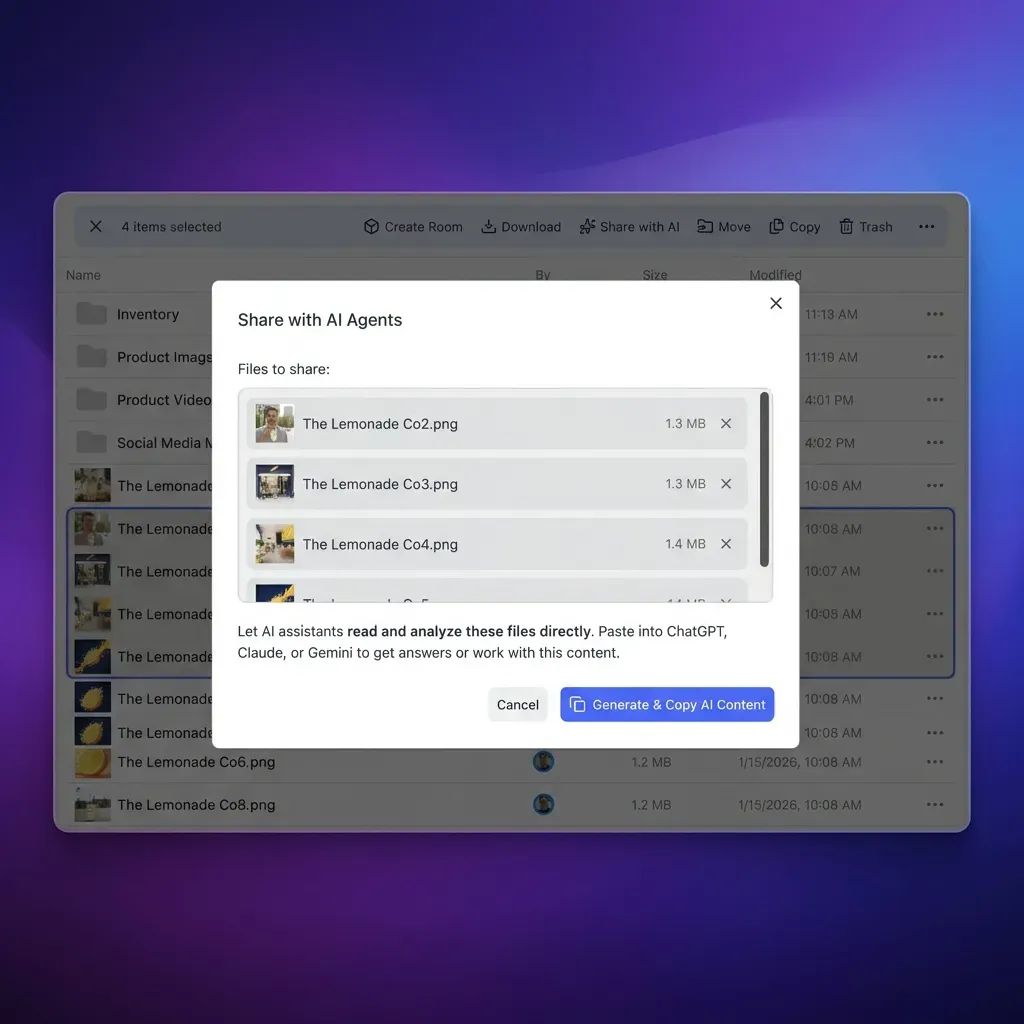
Fastio provides a middle ground designed for this exact handoff. Agents write monitoring reports, dashboard snapshots, and triage summaries to a shared workspace through the Fastio MCP server. Humans access the same workspace through the browser UI. Once Intelligence is enabled for the workspace, uploaded documents are auto-indexed for semantic search, so finding "the incident report from the checkout outage last Tuesday" is a natural language query rather than a filename hunt.
The practical pattern looks like this: an OpenClaw agent pulls Datadog metrics via the Composio integration, generates a formatted report, uploads it to a Fastio workspace, and shares a branded link with the on-call team. Teams can get started with a 14-day Business Trial (credit card required).
For teams running multiple monitoring agents, agents can acquire an advisory file lock before updating shared reports so peers wait on 409 responses, backed by automatic version history on every write. Realtime activity polling and WebSocket events notify downstream systems when new reports land. Audit logs track which agent created or modified each file, which matters when you need to trace a monitoring decision back to its source.
Operational Patterns for Bidirectional Monitoring
Setting up both directions unlocks workflows that neither direction handles alone.
Automated incident triage. Configure Datadog monitors to fire alerts when your agent's error rate exceeds a threshold. A separate OpenClaw agent receives the automation hooks, queries Datadog logs and traces for context, drafts a preliminary root cause analysis, and uploads the report to a shared workspace. The on-call engineer gets a triage summary instead of a raw alert.
Cost tracking and optimization. Datadog LLM Observability captures token usage per span. An OpenClaw agent can query those metrics on a schedule, aggregate costs by agent or workflow, identify the most expensive model calls, and produce a weekly cost report. Teams running multiple agents across different LLM providers often discover that 80% of their token spend comes from 20% of their agent workflows.
SLO-driven agent management. Create Datadog SLOs for your agent fleet, such as "95% of agent requests complete in under 30 seconds" or "hallucination rate stays below 2%." An OpenClaw agent monitors SLO status through the Composio integration and triggers alerts or throttles workloads when burn rates climb. The agent becomes its own reliability engineer.
Cross-service correlation. Datadog connects agent behavior to backend services, infrastructure metrics, and real user sessions within the same trace ID. When an OpenClaw agent fails, the investigation follows the request through API gateways, databases, and container orchestration. The agent can pull this correlated trace data and summarize what went wrong across the full stack.
Each of these patterns produces artifacts: reports, summaries, dashboards, and recommendations. A shared workspace with semantic search and audit trails turns those artifacts from throwaway outputs into a queryable knowledge base that improves over time.
How to Fix Common Setup Problems
No spans appearing in Datadog after plugin installation. The most common cause is a missing permission flag in the plugin configuration. Community observability plugins need explicit access to conversation events before they can emit spans. Check the plugin's README for the required settings, and verify that your OpenClaw version meets the plugin's minimum version requirement.
Composio tools not registering in OpenClaw. Confirm that you have authenticated your Datadog account through the Composio dashboard and that the MCP endpoint is correctly referenced in your OpenClaw configuration. The gateway needs a restart after adding a new MCP server to pick up the registered tools.
High span volume exhausting the free tier. Datadog's free LLM Observability tier covers 40,000 LLM spans per month. If you are running multiple agents, each model call generates a span. Reduce volume by batching agent requests where possible, or by filtering which agents send telemetry. Remember that tool spans, embedding spans, and retrieval spans are not billed, so your actual LLM call count is what matters.
Stale monitoring data in reports. Agents that query Datadog metrics and cache results locally can serve outdated data. Set explicit time windows in your Datadog queries (last 1 hour, last 24 hours) rather than relying on defaults. When uploading reports to a shared workspace, include the query timestamp in the filename or metadata so readers know the data freshness.
Permission errors on Datadog API calls. Composio scopes control which Datadog actions the agent can perform. If an agent can read monitors but cannot create them, check the Composio dashboard for scope configuration. You can bring your own API credentials for finer-grained control.
Sources
References used to verify factual claims in this guide.
-
Datadog free LLM Observability tier includes 40,000 LLM spans per month Datadog bills only on LLM spans while tool, embedding, retrieval, and agent spans are free Datadog LLM Observability Pro tier starts at $160/month for 100,000 LLM spans
-
Composio provides over 40 Datadog tools via MCP integration for OpenClaw
-
OpenClaw community observability plugin captures token usage, model call spans, and tool execution spans via OpenTelemetry
-
ClawHub Datadog skill covers logs, metrics, APM traces, RUM events, incidents, and monitors
Frequently Asked Questions
How do I monitor OpenClaw agents with Datadog?
Install the Datadog Python SDK (ddtrace) or the OpenTelemetry-based observability plugin for OpenClaw. Both auto-instrument LLM calls, capturing latency, token usage, error rates, and cost per span. Datadog's LLM Observability product includes out-of-the-box evaluators for hallucination detection, prompt injection attempts, and sensitive data exposure. The free tier covers 40,000 LLM spans per month.
Can OpenClaw query Datadog metrics?
Yes. The Composio MCP integration registers over 40 Datadog tools into the OpenClaw agent, covering monitors, dashboards, metrics, logs, APM traces, hosts, synthetic tests, and SLOs. Agents issue natural language commands like "show me the p99 latency for the API service" and the MCP tools translate them into Datadog API calls. A lighter-weight ClawHub skill also provides read access to logs, metrics, APM traces, RUM events, incidents, and monitors.
How do I set up Datadog LLM observability for AI agents?
Enable LLM Observability in your Datadog account, then instrument your agent code. For Python, add the ddtrace SDK with LLM Observability enabled. For OpenClaw specifically, you can also use the community OpenTelemetry plugin that captures token usage, model call spans, and tool execution timing. Datadog bills only on LLM spans (actual model calls), while tool, embedding, and retrieval spans are free.
What Datadog data can OpenClaw access?
Through the Composio MCP integration, OpenClaw agents can access monitor details and status, dashboard configurations, host metrics and tags, log search results, APM traces and service dependencies, synthetic test results and locations, SLO status, incidents, events, and organization-level usage summaries. The ClawHub community skill covers a subset focused on logs, metrics, APM traces, RUM events, incidents, and monitors.
Does Datadog LLM Observability have a free tier?
Yes. Datadog offers a free tier with up to 40,000 LLM spans per month at no cost. The Pro tier starts at $160 per month for 100,000 LLM spans. Only LLM spans (direct model calls) are metered. Tool invocations, embedding operations, retrieval steps, and agent orchestration spans are not billed, which keeps costs lower for complex multi-step agents.
Related Resources

Persist your agent monitoring reports across sessions
Upload Datadog triage summaries, cost reports, and incident analyses to a shared workspace. generous storage, MCP-ready endpoint for your OpenClaw agents.