How to Build a Continuous ISP Speed Monitoring Agent with OpenClaw on Raspberry Pi
Running a speed test when your connection feels slow gives you one data point. An OpenClaw agent on a Raspberry Pi gives you thousands by running tests around the clock and logging results with timestamps. The setup pairs headless speed testing tools with an AI agent that reasons about results over time, detecting patterns like peak-hour throttling and content-specific bandwidth restrictions. Stored data becomes evidence you can share with regulators or use in ISP complaints.

Why Continuous Speed Monitoring Beats Spot Checks
Running a speed test when your video starts buffering tells you one thing: your connection is slow right now. It does not tell you whether the speed drops every evening between 7 PM and 11 PM, whether your ISP treats Netflix traffic differently from other downloads, or whether your plan's advertised speeds bear any relationship to what you actually receive.
According to 2025 FCC broadband transparency filings, 72% of ISPs engage in some form of traffic management. That management often means reduced throughput during peak hours, with average speed reductions of 40% to 60% for streaming and peer-to-peer traffic. ISPs rarely volunteer this information. They rely on the fact that most customers check their speed once or twice and then give up.
Manual speed testing is biased by definition. You test when something feels wrong, which means your data only captures bad moments. You never record the 3 AM baseline when nobody else on your neighborhood node is streaming. You never capture the gradual decline that happens over months as your ISP oversubscribes local capacity.
What you need is a device that runs tests around the clock, logs every result with a timestamp, and surfaces patterns that would take months of manual testing to notice. A Raspberry Pi plugged into your router draws 5 to 8 watts and costs a few dollars per year in electricity. Leave it running and it produces a continuous record of your ISP's actual performance.
The gap between a cron job and an AI agent is the reasoning layer. Cron runs the test on schedule. The agent decides what the results mean. It tracks baselines, detects anomalies, correlates speed drops with time of day, and composes summaries that turn raw numbers into evidence.
Related guides
- How to Build a Hermes Agent AI Code CheckerThe proportion of copy-pasted code in repositories rose from 8% in 2020 to 12% in 2024, representing a 48% relative...
- How to Build AI Agents with the Claude Agent SDKThe Claude Agent SDK is Anthropic's toolkit for building AI agents that can read files, run commands, search the web,...
- How to Build a Solar Panel Monitoring Agent with OpenClaw on Raspberry PiMost Raspberry Pi solar monitors log voltage and current to a CSV or dashboard. This guide adds an intelligence layer:...
- How to Build a Marine NMEA Monitoring Agent with OpenClaw and Raspberry PiMost Raspberry Pi marine projects stop at parsing NMEA data for display. This guide goes further: you'll connect a Pi...
- How to Build an Air Quality and CO2 Monitoring Agent with OpenClaw on Raspberry PiMost Raspberry Pi air quality projects log sensor data to a dashboard and stop there. This guide goes further: wire...
- How to Build a mmWave Radar Presence Detection Agent with OpenClaw on Raspberry PiPIR sensors miss people who sit still. mmWave radar does not. This guide covers wiring a 24GHz FMCW radar module to a...
More on this subject: OpenClaw on Raspberry Pi (192 guides)
Speed Testing Tools That Run Headless
Several speed testing tools work on Raspberry Pi without a graphical interface. Each measures different aspects of your connection, and using more than one strengthens your dataset.
Ookla Speedtest CLI
The official Ookla Speedtest CLI is the same measurement engine behind speedtest.net, packaged as a standalone binary available for ARM64. It outputs JSON with download bandwidth (bytes per second), upload bandwidth, latency, jitter, packet loss percentage, ISP name, and test server details. Server selection is configurable, so you can pin tests to the same server for consistent comparisons or rotate servers to test routing from multiple endpoints.
Ookla distributes ARM64 packages through their own repository. After adding the GPG key and package source, installation is a single apt install. The JSON output makes it straightforward to parse results into structured logs that the agent can analyze.
fast.com CLI (Netflix)
Netflix's fast.com measures download speed specifically from Netflix CDN servers. This matters because ISPs sometimes throttle Netflix traffic while leaving generic speed tests untouched. If Ookla reports 100 Mbps and fast.com reports 25 Mbps on the same connection at the same time, that discrepancy is strong evidence of content-specific throttling. The fast-cli npm package provides a command-line interface, though its output is less structured than Ookla's.
NDT (M-Lab)
Google-backed Measurement Lab runs NDT (Network Diagnostic Tool) servers worldwide. NDT measures throughput, latency, and packet retransmission between your connection and a nearby measurement server. M-Lab data feeds into public broadband research, and the ndt7-client binary runs on ARM64. Using NDT alongside Ookla gives you a second independent measurement source that ISPs cannot game without also improving real traffic performance.
The practical recommendation is to use Ookla Speedtest CLI as your primary tool for its structured JSON output and server control. Add fast.com tests at a lower frequency, a few times per day, to detect content-specific throttling. This combination covers both general bandwidth measurement and ISP behavior toward specific services.
Hardware and OpenClaw Setup
Hardware
A Raspberry Pi 4 with 4 GB RAM handles speed monitoring comfortably. A Pi 5 with 8 GB gives more headroom if you plan to run additional services alongside the monitoring agent. The critical requirement is a wired Ethernet connection. WiFi introduces its own latency and throughput variability, which contaminates your measurements. If you are measuring ISP performance, you need to eliminate your local wireless network as a confounding variable. Connect the Pi directly to your router with an Ethernet cable.
Storage requirements are modest. A 16 GB SD card holds the OS, OpenClaw, and months of speed test logs without issue. If you prefer durability for a long-running deployment, a USB SSD eliminates SD card wear concerns.
Total hardware cost runs from $45 to $80 for a Pi 4 kit, or $80 to $120 for a Pi 5 kit.
Installing speed test tools
Install the Ookla Speedtest CLI by adding their ARM64 package repository and running the package install. After installation, run a single test manually to accept the license agreement and verify the tool works. The first run also caches the server list, which speeds up subsequent automated tests.
For fast.com testing, install the fast-cli package through npm. Node.js is already available on the Pi after the OpenClaw installation, so npm is ready to use.
OpenClaw installation
Follow the official Raspberry Pi installation guide at docs.openclaw.ai/install/raspberry-pi. The process installs Node.js 24 from the NodeSource ARM64 repository, runs the OpenClaw setup script, and configures a systemd service that starts the agent on boot. The minimum requirements are 1 GB RAM and 500 MB free disk, so OpenClaw coexists comfortably with speed testing tools on any Pi 4 or Pi 5.
For headless Pi deployments, use API key authentication rather than browser-based OAuth. Configure OpenClaw to use a cloud LLM provider such as Anthropic Claude, OpenAI, or Google Gemini. The Pi does not run models locally. It sends short prompts to the cloud API and acts on the responses. Speed monitoring prompts are brief and infrequent, keeping API costs under a few dollars per month.
Set the Pi's timezone so the agent's scheduling and time-of-day analysis align with your local clock. The OpenClaw installation guide covers this as part of setup.


Store Your Speed Data Where You Can Search It
Upload speed test logs to a secure workspace, query results with AI once Intelligence is enabled, and share evidence when you need it.
How the Agent Detects Throttling Patterns
The value of an AI agent over a cron script is context-aware reasoning. A cron job runs a speed test every 30 minutes and appends JSON to a file. The agent interprets those results against accumulated history and decides what they mean.
Time-of-day patterns
The most common throttling pattern is peak-hour degradation. If your download speed averages 200 Mbps at 3 AM but drops to 80 Mbps between 7 PM and 11 PM consistently across weeks of data, that pattern points to intentional traffic management rather than incidental congestion. The agent tracks speed by time bucket and flags sustained deviations from off-peak baselines. It distinguishes between a single bad evening (which could be a CDN issue or local congestion) and a repeating weekly pattern that suggests active management.
Content-specific throttling
Comparing results from different test tools reveals whether your ISP treats traffic types differently. If Ookla consistently reports higher speeds than fast.com on the same connection, the ISP may be throttling Netflix CDN traffic specifically. The agent can schedule paired Ookla and fast.com tests at the same intervals and flag persistent discrepancies between the two.
VPN comparison testing adds another diagnostic layer. The agent runs a speed test normally, then runs the same test through a VPN. If VPN-routed traffic consistently delivers higher throughput than direct traffic, the ISP is likely inspecting packets and throttling based on content type. Network measurement research shows that VPN comparison testing detects throttling with approximately 94% accuracy because it isolates the ISP's traffic management from other variables.
Anomaly detection
Rather than using a fixed threshold ("alert if speed drops below 50 Mbps"), the agent maintains a rolling baseline that adapts to your actual service level. A connection that normally delivers 100 Mbps treats a drop to 40 Mbps as an anomaly. A connection that normally delivers 25 Mbps treats 40 Mbps as an improvement. The agent learns your connection's normal range and flags deviations from that range, regardless of the absolute numbers.
Periodic summaries
The agent generates weekly reports: average speeds by time of day, worst-performing periods, week-over-week trends, and a throttling probability assessment based on accumulated patterns. These reports transform a folder of JSON files into a narrative that non-technical family members or ISP customer service representatives can follow.
Storing and Querying Historical Speed Data
Speed test results accumulate quickly. At one test every 15 minutes, you generate 96 data points per day and roughly 2,900 per month. How you store and access that data determines whether it becomes useful evidence or a pile of unread log files.
Local storage options
The simplest approach is appending JSON results to a file on the Pi's storage. This works but makes querying difficult beyond basic text searches. SQLite offers structured storage without external dependencies. The agent can insert each test result as a row and run queries for time-range analysis.
For visualization, InfluxDB paired with Grafana is the most popular combination in the Pi speed monitoring community. InfluxDB handles time-series data natively, and Grafana renders interactive dashboards with speed-over-time charts. This setup runs entirely on the Pi but is only accessible from your local network unless you set up a reverse proxy or VPN tunnel.
Cloud-backed storage with Fastio
Local dashboards work well for personal monitoring but fall short when you need to share data or query it conversationally. Uploading speed test logs to a Fastio workspace adds capabilities that local storage cannot match.
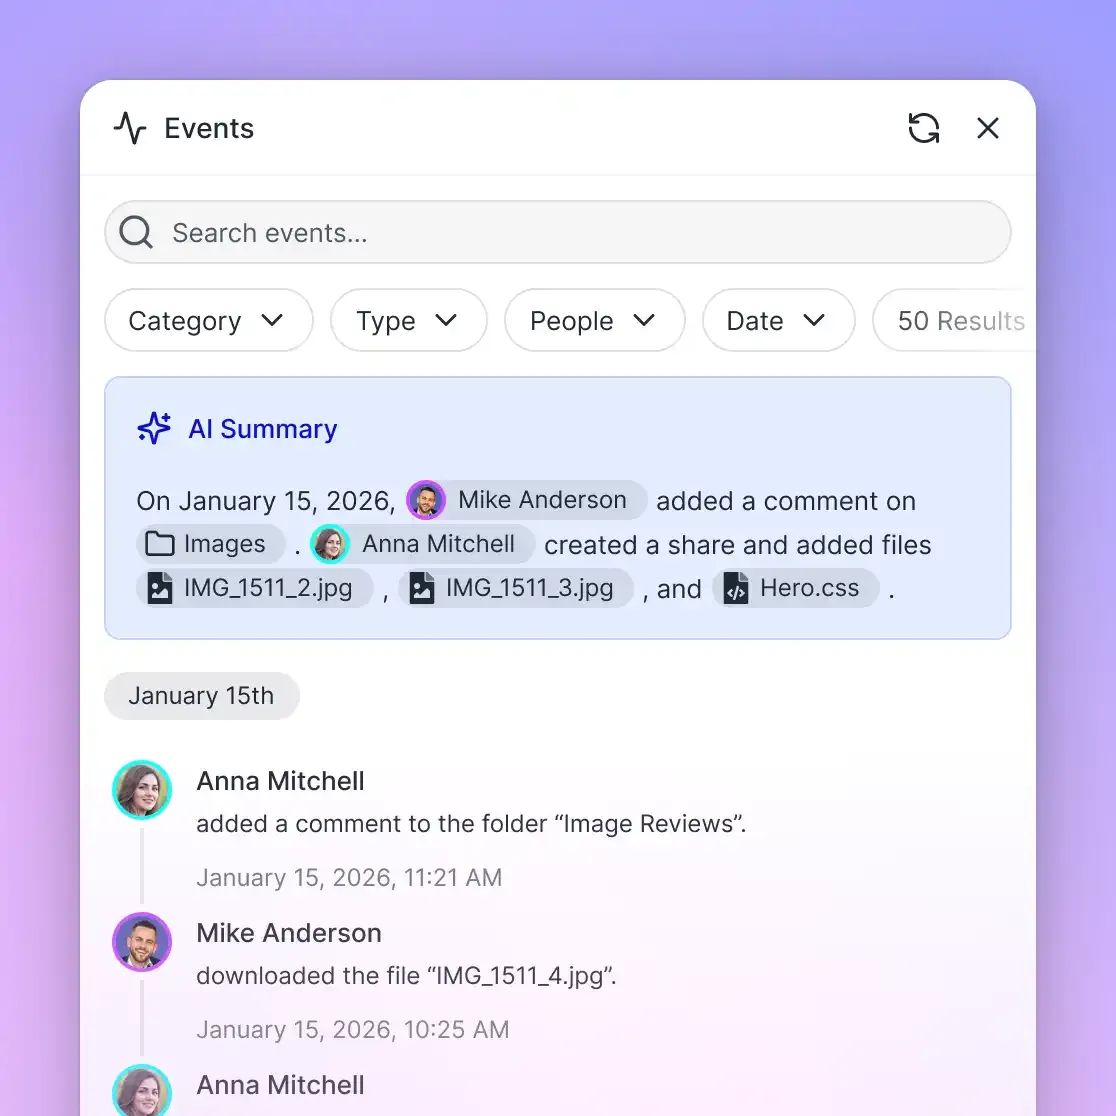
The agent can upload daily or weekly log batches through Fastio's MCP server. Once files land in a workspace with Intelligence Mode enabled, they are automatically indexed for semantic search. Instead of writing SQL queries or parsing JSON manually, you can ask questions in plain language: "when did download speed drop below 50 Mbps last month?" or "compare evening speeds between April and May." Intelligence Mode returns answers with citations pointing to specific log entries.
Sharing is where cloud storage becomes essential for ISP accountability. If you are building a throttling case, you need to share evidence with people who cannot SSH into your Pi. Fastio workspaces support granular permissions, so you can give read access to a consumer advocacy group, a lawyer, or a regulatory body without exposing your entire file collection. Fastio offers a 14-day Business Trial, card required; see pricing for plan options with ample storage to cover speed monitoring logs for years.
If you built this setup for someone else, Fastio's ownership transfer lets you hand the workspace to the recipient while retaining admin access for ongoing maintenance.
Turning Speed Data into ISP Accountability
Months of timestamped speed data transform a frustrating customer service call into a documented complaint.
What the data proves
Consistent speed test results over time demonstrate the gap between advertised and delivered speeds. Most ISP contracts include "up to" language and "best effort" clauses that provide legal cover for occasional slowdowns. But if your 200 Mbps plan consistently delivers 80 Mbps during peak hours across three months of data, that pattern exceeds what "best effort" was designed to excuse.
VPN comparison data strengthens the case. If your direct connection shows 80 Mbps while VPN-routed traffic on the same connection shows 180 Mbps, the bottleneck is not your local infrastructure or the ISP's backbone capacity. It is deliberate traffic management applied to specific traffic types.
Filing regulatory complaints
In the United States, the FCC accepts broadband complaints through its Consumer Complaint Center. Documented speed data that is timestamped and measured from a consistent location with a wired connection carries more weight than anecdotal reports. Similar regulatory bodies exist in other countries: Ofcom in the United Kingdom, the ACCC in Australia, and the CRTC in Canada.
The agent can compile complaint-ready summaries from your speed data. These summaries highlight the worst periods, calculate the percentage of time your connection delivered less than the advertised speed, and include VPN comparison results where available. Having the agent draft these summaries saves hours of manual data analysis and ensures you present the most relevant evidence rather than dumping raw logs on a complaint form.
Contributing to broadband research
M-Lab accepts speed measurement data for public broadband research. If you run NDT tests alongside your Ookla tests, your results contribute to a global dataset that researchers and policymakers use to evaluate ISP performance across regions. Your individual monitoring setup becomes part of a larger accountability effort that benefits everyone in your area.
Sources
References used to verify factual claims in this guide.
-
72% of ISPs engage in some form of traffic management according to 2025 FCC broadband transparency filings Average throttled speed reduction of 40% to 60% for streaming and peer-to-peer traffic
-
VPN comparison testing detects ISP throttling with approximately 94% accuracy
-
OpenClaw minimum requirements are 1 GB RAM, 1 core, 500 MB free disk on 64-bit OS
-
Ookla Speedtest CLI JSON output includes download and upload bandwidth in bytes per second, latency, jitter, and packet loss
Frequently Asked Questions
How do you continuously monitor internet speed on Raspberry Pi?
Install the Ookla Speedtest CLI on a Raspberry Pi connected to your router via Ethernet. Schedule tests at regular intervals (every 15 to 30 minutes) and log results in JSON format. An AI agent like OpenClaw can manage the scheduling, parse results, and generate trend reports automatically. The Pi runs 24/7 on minimal power, producing a continuous record of your ISP's actual performance.
Can AI detect ISP throttling?
An AI agent detects throttling by analyzing speed test data for patterns that a single test cannot reveal. It compares speeds across time of day to identify peak-hour degradation, runs paired tests with different tools (Ookla vs. fast.com) to detect content-specific throttling, and uses VPN comparison tests to isolate ISP-side traffic management. Over weeks of data, these patterns become statistically clear even when individual test results look normal.
What is the best way to log internet speed over time?
For local-only analysis, store JSON speed test results in SQLite on the Pi and visualize them with Grafana. For sharing and natural-language querying, upload logs to a cloud workspace like Fastio with Intelligence Mode enabled. The cloud approach lets you ask questions about your data in plain language and share evidence with ISPs, regulators, or advocacy groups without giving them access to your local network.
How accurate is the Ookla Speedtest CLI on Raspberry Pi?
The Ookla Speedtest CLI on a Pi connected via Ethernet produces results comparable to desktop speed tests. The key variable is the Ethernet connection. WiFi testing introduces radio interference, channel congestion, and distance-related signal loss that make results unreliable as a measure of ISP performance. Always use a wired connection for monitoring accuracy.
Does running automated speed tests use a lot of bandwidth?
Each speed test transfers roughly 50 to 200 MB depending on your connection speed and test duration. At one test every 30 minutes, that adds up to 2.4 to 9.6 GB per day. If your plan has a data cap, reduce test frequency to once per hour or run shorter tests. Most unlimited residential plans handle this volume without issue.
Can this monitoring setup work over WiFi instead of Ethernet?
It can run over WiFi, but the results will measure your WiFi performance combined with your ISP performance, making it impossible to isolate ISP-specific issues. A WiFi-connected Pi might show speed drops caused by microwave interference, neighbor channel congestion, or distance from the access point. For ISP accountability, wired Ethernet is necessary to ensure your measurements reflect the connection your ISP delivers to your router, not your local wireless conditions.
Related Resources

Store Your Speed Data Where You Can Search It
Upload speed test logs to a secure workspace, query results with AI once Intelligence is enabled, and share evidence when you need it.