Best OpenClaw Tools for AI Anomaly Detection and Data Monitoring
Most anomaly detection platforms assume you have a dedicated ML team and managed infrastructure. Five skills on ClawHub take a different approach: install them into an OpenClaw agent, point at your data sources, and let the agent run scheduled checks that flag unusual patterns. This guide ranks each tool by detection capability, data source support, and automation readiness, then shows how to combine them into a monitoring pipeline.


Why Agent-Based Detection Works Without ML Infrastructure
ClawHub's skill registry expanded from 1,200 entries in November 2025 to over 18,000 by March 2026, according to Palo Alto Networks Unit 42 research. Among those thousands of skills, fewer than a dozen address anomaly detection directly. That gap matters because most teams that want automated data monitoring still reach for enterprise platforms like Datadog or Splunk, paying for infrastructure they might not fully need.
Traditional anomaly detection requires three things most small teams lack: a data pipeline to collect and normalize metrics, an ML model to identify outliers, and an alerting system to notify the right people. Each piece needs its own infrastructure, its own maintenance budget, and usually its own specialist.
An OpenClaw agent with the right skills can connect to a PostgreSQL database, run statistical analysis on fresh data, compare results against historical baselines, and send a Slack message when something looks off. OpenClaw's built-in cron scheduler handles the timing. The agent's workspace holds the configuration. No pipeline infrastructure, no model training, no separate alerting service.
The tradeoff is precision. A purpose-built ML model trained on your specific data will catch subtler anomalies than a general-purpose statistical approach. But for teams that need "tell me when error rates spike" or "flag revenue drops greater than 15%," the agent-based approach works today with tools that take minutes to configure.
Related guides
- Best n8n Tools for AI Agents: Top 10 Nodes for 2026n8n changed AI automation with its visual workflow builder. We rank the best nodes and integrations for building...
- Best Tools for CrewAI Agents: Top Picks for 2026CrewAI agents need good tools to be useful. The framework handles coordination, but external integrations let agents...
- Top OpenClaw Tools for AI Data Extraction from Screenshots and Visual ContentAgent Browser passed 58,600 installs on Composio in early 2026, signaling that developers need tools for data locked...
- How to Choose the Best OpenClaw Tools for Data ScientistsFinding the right integrations for your AI assistants changes how you handle data. OpenClaw tools for data scientists...
- Top OpenClaw Tools for AI Content Detection in 2026OpenClaw's skill ecosystem now includes several paths for integrating AI content detection into automated publishing...
- Top OpenClaw Tools for Graphic DesignersGraphic designers use top OpenClaw tools to handle routine tasks like resizing files and generating palettes. These...
More on this subject: OpenClaw Tools (101 guides)
How We Evaluated These Tools
We scored each tool across five criteria:
Detection capability: Can it identify statistical outliers, distribution shifts, missing data patterns, or threshold violations?
Data source support: What databases, file formats, and APIs does it connect to?
Automation readiness: Does it work with OpenClaw's cron scheduler and Slack or automation hooks notifications?
Output quality: Does it produce structured findings that humans can review without re-running the analysis?
Setup effort: How quickly can you go from install to first anomaly report?
Here is a quick comparison of data source support across the five tools:
- data-analyst: SQL databases, CSV, spreadsheets
- ChartGen: XLSX, CSV, JSON
- SQL Toolkit: SQLite, PostgreSQL, MySQL
- Code Skill: Any Python-readable format (CSV, JSON, APIs, databases via connectors)
- Fast.io: Stores and indexes any file format agents produce
Every tool on this list is available through ClawHub or as a standalone service. We excluded tools that required paid subscriptions to evaluate, since the point of agent-based detection is keeping the barrier low.
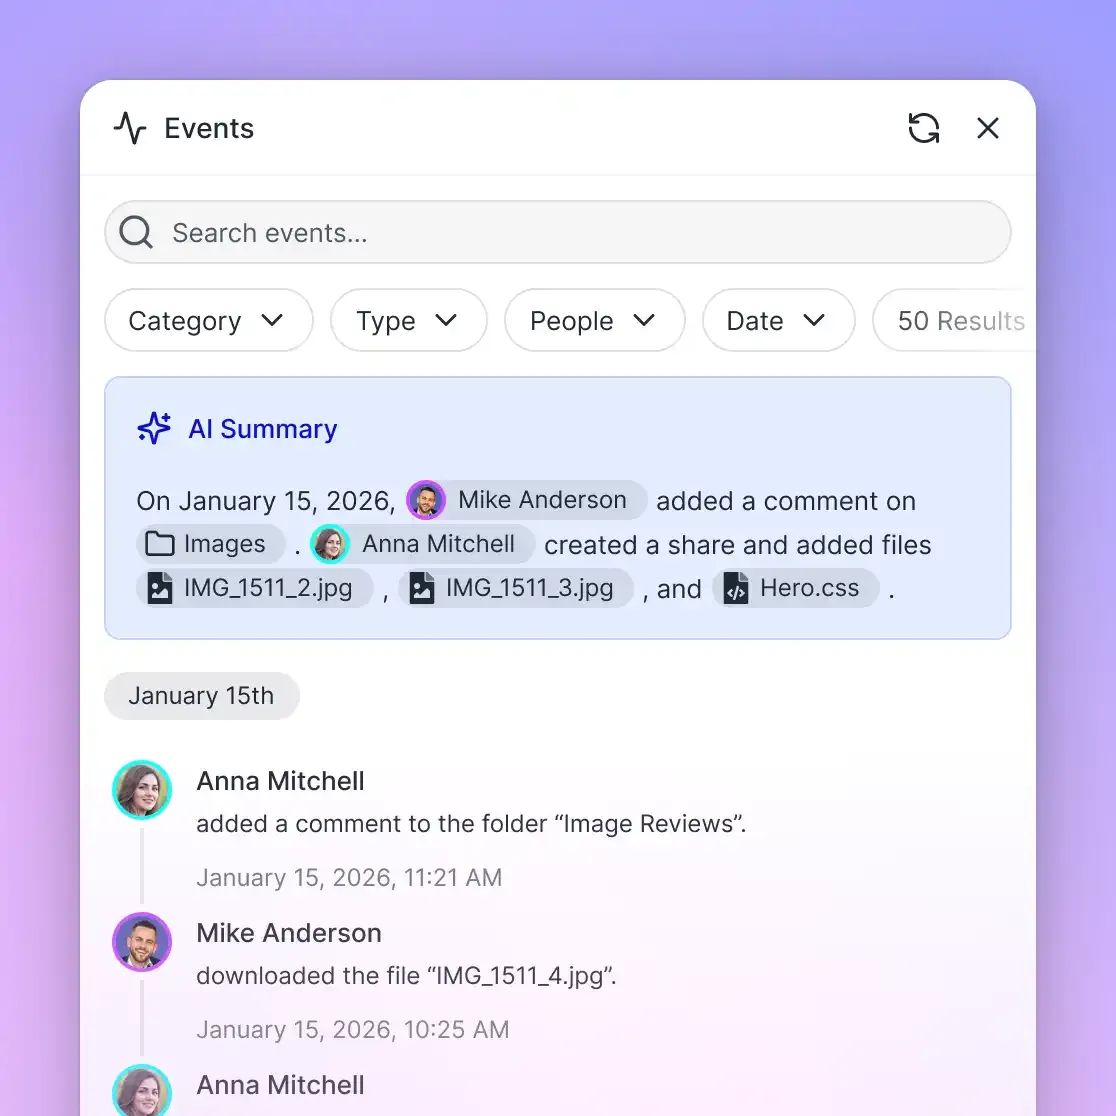
The 5 Best OpenClaw Tools for Anomaly Detection
Each tool below fills a different role in an anomaly detection workflow. Some handle the analysis, others handle visualization or storage. The most effective setups combine two or three of these together. A typical starting point: install the data-analyst skill for broad detection, add ChartGen to make findings visual, and connect both to a Fast.io workspace so reports persist across sessions and stay searchable by your team.
1. data-analyst Skill
The data-analyst skill on ClawHub gives an OpenClaw agent the ability to run exploratory data analysis, flag anomalies, generate KPI reports, and prepare data for ETL workflows. It connects to SQL databases and handles spreadsheets and CSV files directly.
Key strengths:
- Statistical analysis including descriptive stats, distribution checks, and outlier identification
- KPI reporting with trend comparisons across time periods
- Cohort analysis for segmented data monitoring
- Transaction trend analysis for spotting shifts in purchasing or usage patterns
Limitations:
- Broad scope means you need to prompt the agent specifically for anomaly detection rather than general analysis
- No built-in visualization, so pair it with ChartGen for charts
Best for: Teams running regular data quality checks across SQL databases and spreadsheets who want a single skill that covers EDA, anomaly detection, and reporting in one package.
2. ChartGen
ChartGen is an AI-powered visualization skill that turns raw data into charts while automatically identifying patterns, outliers, and trends. You describe what you want in plain English, and the skill selects the appropriate chart type, generates the visual, and highlights data points that fall outside expected ranges.
The skill supports over 30 chart types across six categories: comparison (bar, stacked variants), trends (line, area, sparkline), composition (pie, treemap), distribution (scatter, histogram, box plot), specialized (funnel, waterfall, Gantt, radar), and advanced (heatmap, combo, Sankey, gauge). It accepts XLSX, CSV, and JSON input and exports to PNG or SVG.
Key strengths:
- Automatic anomaly and outlier detection built into the analysis layer
- Over 30 chart types matched automatically to your data
- Actionable recommendations generated alongside each visualization
- MIT-0 license with free credits for new users
Limitations:
- Visualization-first tool: it surfaces anomalies visually but does not run upstream data extraction
- Needs a data source skill (data-analyst, SQL Toolkit, or Code) to feed it raw data
Best for: Making anomaly findings visible to stakeholders who don't want to read raw numbers. Pairs well with a data extraction skill for a complete detection-to-reporting pipeline.
3. SQL Toolkit
The SQL Toolkit skill connects your OpenClaw agent directly to SQLite, PostgreSQL, and MySQL databases. It handles everything from simple SELECT queries to complex window functions, CTEs, and EXPLAIN analysis for query optimization.
For anomaly detection, the SQL approach has a specific advantage: you write the detection logic as queries. A window function comparing today's error count to the 30-day rolling average catches spikes that a general statistical tool might miss because it lacks the domain context you encode in SQL. You can define "anomaly" precisely for your business: a refund rate above 3%, a latency percentile that crosses a threshold, or a user count that drops below a seasonal baseline.
Key strengths:
- Direct database connectivity for three major SQL engines
- Window functions and CTEs for time-series anomaly patterns
- EXPLAIN analysis to optimize performance on large monitoring queries
- Schema design and migration support for maintaining dedicated monitoring tables
Limitations:
- SQL-only: no support for NoSQL databases, APIs, or flat files
- Requires SQL knowledge to write effective anomaly detection queries
Best for: Database administrators and data engineers who prefer writing anomaly detection logic in SQL rather than Python. Strong for monitoring transactional databases where domain-specific thresholds matter more than generic statistical models.
4. Code Skill
The Code skill gives your OpenClaw agent a structured Python development workflow for planning, implementing, and verifying scripts. For anomaly detection, this means access to the full Python data science ecosystem: pandas for data wrangling, scikit-learn for isolation forests and one-class SVMs, statsmodels for time series decomposition, and scipy for statistical tests.
Where the data-analyst skill provides general EDA with anomaly flagging, the Code skill lets you build detection logic tuned to your exact data characteristics. If you need a seasonal ARIMA decomposition that accounts for holiday effects, or an isolation forest trained on six months of baseline data, the Code skill gives you the flexibility to implement it.
Key strengths:
- Full Python ecosystem access (pandas, numpy, scikit-learn, statsmodels)
- Custom detection algorithms tuned to your specific data patterns
- Can pull data from any source Python supports: REST APIs, databases via SQLAlchemy, S3 buckets, local files
- Structured workflow with planning and verification steps prevents unvalidated code from running
Limitations:
- Requires Python knowledge to guide the agent toward the right algorithms
- Offline by default: needs cron scheduling for recurring automation
Best for: Teams that need custom ML-based detection (isolation forests, autoencoders, DBSCAN clustering) or integration with data sources the other skills do not cover natively.
5. Fast.io
Fast.io is not an analysis engine. It is the storage and collaboration layer where your agent deposits findings and your team picks them up. When an OpenClaw agent running a data-analyst or Code skill detects an anomaly, the results need to go somewhere persistent, searchable, and shareable.
You could store reports on the local filesystem or push them to S3, but neither option makes the findings searchable by meaning or accessible to teammates without extra tooling. Fast.io's Intelligence Mode auto-indexes uploaded files for semantic search once Intelligence is enabled for the workspace, so a team lead can ask "show me anomaly reports from last week" and get relevant results without knowing exact filenames. Ownership transfer lets an agent build a monitoring workspace and hand it to a human when the project is ready.
Key strengths:
- Persistent workspace storage built for agent workflows, with a 14-day Business Trial (card required)
- MCP server with a consolidated MCP toolset for automated uploads and workspace management
- Intelligence Mode indexes uploaded reports for natural language search once enabled
- Ownership transfer lets agents build workspaces and hand them off to human team leads
- Granular permissions control who sees which reports at the org, workspace, folder, and file level
Limitations:
- Not a detection tool: requires upstream analysis skills for the actual anomaly identification
- Intelligence Mode works on uploaded files, not live database connections
Best for: Teams that need a central hub for anomaly reports, with built-in search and the ability to share findings through branded portals or direct workspace access. Connects to OpenClaw agents via MCP at fast.io/storage-for-openclaw.
How to Build a Scheduled Detection Pipeline
The real value of these tools shows up when you chain them together with OpenClaw's automation layer. OpenClaw's documentation describes cron as the mechanism that "persists jobs, wakes the agent at the right time, and can deliver output to a chat channel or automation hooks endpoint." A typical anomaly detection pipeline chains five steps:
- Data extraction: The SQL Toolkit or data-analyst skill pulls fresh data from your production database or data warehouse on a cron schedule
- Analysis: The Code skill runs your detection logic, whether that is a z-score threshold, an isolation forest, or a custom business rule like "flag any day where refund rate exceeds 3%"
- Visualization: ChartGen generates distribution plots and trend lines highlighting the flagged anomalies
- Storage: The agent uploads the complete report (charts, raw data, and findings summary) to a Fast.io workspace
- Notification: OpenClaw's Slack skill sends a digest with key findings and a link to the full report in the workspace
For most monitoring use cases, a daily or hourly cron schedule covers it. OpenClaw also supports a heartbeat mechanism for approximate periodic checks (default every 30 minutes), which works well when exact timing does not matter but you want consistent monitoring throughout the day.
The advantage over traditional pipeline tools like Airflow or Prefect: no infrastructure to manage. The OpenClaw agent runs locally, the skills handle the work, and Fast.io stores the output where your team can find it.
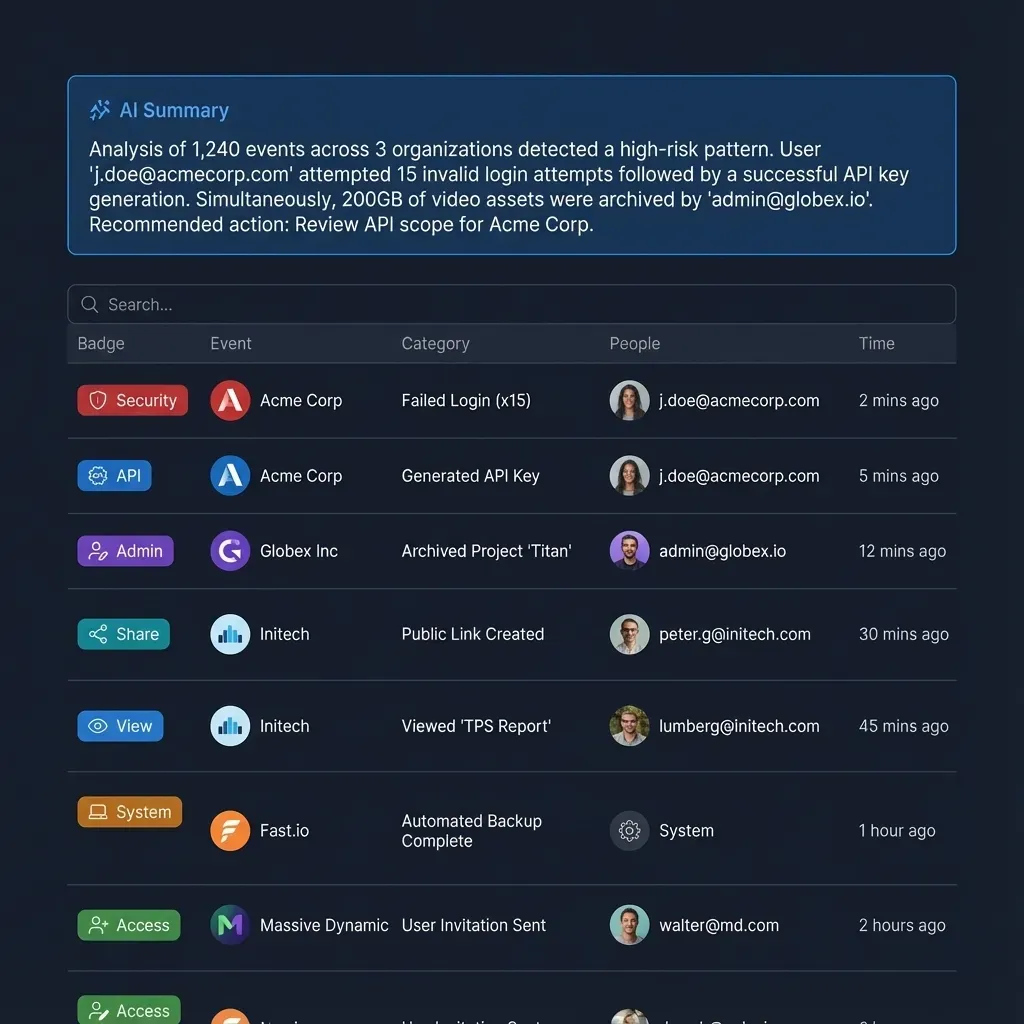


Keep every anomaly report searchable and shareable
A workspace with MCP access for your OpenClaw agent. Upload detection results, search across reports once Intelligence is enabled, and transfer the workspace to your team. Starts with a 14-day Business Trial.
Choosing the Right Tool for Your Monitoring Needs
Your choice depends on where your data lives and how much customization you need.
If your data is in a SQL database and you are comfortable writing queries, start with the SQL Toolkit. It gives you the most control over detection logic with the least setup overhead.
If you want a general-purpose tool that handles multiple data formats and includes anomaly detection as one of many capabilities, the data-analyst skill is the broadest option. It covers EDA, KPI reporting, cohort analysis, and anomaly flagging in a single install.
If you need custom ML models or your data comes from REST APIs and other sources the above skills do not support natively, the Code skill gives you full Python access to build exactly what you need.
For any of these paths, add ChartGen for visualization and Fast.io for persistent storage and team access. Those two handle the question that follows every detected anomaly: making the findings visible and actionable for the people who need to respond.
Sources
References used to verify factual claims in this guide.
-
ClawHub's skill registry expanded from 1,200 entries in November 2025 to over 18,000 by March 2026
-
Over 30 visualization types across six categories with automatic anomaly and outlier detection
-
Cron persists jobs, wakes the agent at the right time, and can deliver output to a chat channel or webhook endpoint
Frequently Asked Questions
How does AI detect anomalies?
AI anomaly detection uses statistical methods and machine learning algorithms to identify data points that differ from expected patterns. Common approaches include z-score analysis for numerical outliers, isolation forests that isolate unusual observations in high-dimensional data, and time series decomposition that separates seasonal trends from true anomalies. The AI component automates the baseline learning step: instead of manually defining thresholds, the model establishes expected behavior from historical data and flags deviations that exceed a configurable confidence interval.
What is the best tool for anomaly detection?
It depends on your data and team. For SQL databases, the SQL Toolkit lets you write detection queries directly with window functions and CTEs. For general data analysis with built-in anomaly detection, the data-analyst skill on ClawHub covers the widest range of use cases. For custom ML models like isolation forests or autoencoders, the Code skill with Python access gives the most flexibility. Enterprise teams with large-scale, high-throughput requirements may still benefit from dedicated platforms like Datadog or Splunk.
Can OpenClaw analyze data?
Yes. OpenClaw agents can install skills from ClawHub that enable data analysis, including the data-analyst skill for exploratory data analysis and anomaly detection, the SQL Toolkit for direct database queries, the Code skill for custom Python analysis, and ChartGen for data visualization. Combined with OpenClaw's cron scheduler, these skills can run automated analysis on a recurring schedule and deliver findings via Slack or automation hooks notifications.
What is an anomaly detection algorithm?
An anomaly detection algorithm is a mathematical method for identifying data points, events, or observations that deviate from an expected pattern. Common algorithms include statistical methods (z-score, interquartile range), machine learning approaches (isolation forest, one-class SVM, DBSCAN), and deep learning methods (autoencoders, LSTMs for time series). The right choice depends on your data dimensionality, whether anomalies are point-based or contextual, and whether you have labeled examples of known anomalies to train a supervised model.
Related Resources

Keep every anomaly report searchable and shareable
A workspace with MCP access for your OpenClaw agent. Upload detection results, search across reports once Intelligence is enabled, and transfer the workspace to your team. Starts with a 14-day Business Trial.