How to Use Raspberry Pi Sense HAT with OpenClaw for Environmental Monitoring
The Raspberry Pi Sense HAT packs six calibrated sensors onto a single board that plugs directly into any Pi with a 40-pin GPIO header. Combined with an OpenClaw AI agent, it becomes a monitoring platform that reads temperature, humidity, pressure, and motion data, displays status on its built-in LED matrix, and pushes structured alerts when readings drift outside normal ranges.


Why Most Sense HAT Projects Waste Half the Hardware
The global IoT environmental sensor market will exceed $9.6 billion in 2026, growing at a 27.5% compound annual rate since 2021, according to Verified Market Reports. Organizations across agriculture, facilities management, and manufacturing are investing in automated monitoring that goes beyond static thresholds. Yet one of the most accessible multi-sensor platforms available, the Raspberry Pi Sense HAT at $33, is still taught almost exclusively as a "print the temperature" exercise.
The Sense HAT was originally developed for the Astro Pi program, a collaboration between the Raspberry Pi Foundation and the European Space Agency. Two Sense HAT-equipped Pis have been running on the International Space Station since 2015, collecting environmental data in microgravity. The Raspberry Pi Foundation designed the board for exactly this kind of continuous, multi-sensor work. It packs six distinct sensor types, an 8x8 RGB LED matrix, and a five-button joystick into a single HAT (Hardware Attached on Top) form factor, with guaranteed production through at least January 2028.
Most tutorials cover the basics: install the library, call get_temperature(), print the result. Some show how to scroll text across the LED matrix. few treat the Sense HAT as what it actually is, a ready-made environmental monitoring platform with six independent data streams. When you combine it with an AI agent framework like OpenClaw, the Sense HAT becomes more than a teaching tool. The agent can read all six sensors on a schedule, reason about trends in the data, flag anomalies, and push structured logs to cloud storage where humans or other agents can act on them.
This guide covers the full pipeline: hardware setup, Python sensor code, LED visualization, OpenClaw agent integration, and cloud storage for persistent logs.
Related guides
- Claude Code Teams: Multi-Agent Orchestration GuideClaude Code agent teams split complex coding tasks across multiple independent AI sessions. Each teammate gets its own...
- How to Set Up Claude Flow for Multi-Agent Code OrchestrationClaude Flow passed 710,000 lifetime npm downloads by mid-2026, making it the most-installed community orchestrator for...
- Raspberry Pi Soil Moisture Sensor Setup for Automated Garden Monitoring with OpenClawResistive soil moisture probes corrode within weeks of continuous use, sending most Raspberry Pi garden projects to an...
- How to Set Up the Raspberry Pi I2C Bus for Multi-Sensor OpenClaw AgentsI2C lets a Raspberry Pi talk to dozens of sensors over just two wires, but most tutorials stop at printing a single...
- Raspberry Pi Temperature Sensor Guide: DS18B20 and DHT22 with OpenClawRaspberry Pi shipped 7.6 million units in 2025, and temperature sensing remains the most common first hardware project...
- How to Build a Wireless Sensor Decoder Agent with RTL-433 and OpenClaw on Raspberry Pirtl_433 decodes signals from over 320 wireless device protocols using a cheap USB radio dongle. Pairing it with an...
More on this subject: OpenClaw on Raspberry Pi (192 guides)
Sense HAT Hardware and Sensor Specifications
The Sense HAT V2 connects to any Raspberry Pi with a 40-pin GPIO header, including the Raspberry Pi 5. If your Pi 5 has a cooling fan installed, you may need standoff risers to create clearance between the fan and the HAT board. The board communicates with the Pi over I2C and draws power directly from the GPIO header.
Environmental sensors
- STMicro LPS25HB barometric pressure sensor: measures 260 to 1,260 hPa with 24-bit output. Also provides a secondary temperature reading across the 0 to 65 degrees Celsius range with accuracy of plus or minus 2 degrees.
- STMicro HTS221 humidity and temperature sensor: covers 0% to 100% relative humidity with 16-bit output. Temperature accuracy is plus or minus 0.5 degrees Celsius. Humidity accuracy is plus or minus 4.5% RH in the 20% to 80% range.
- TCS3400 color and ambient light sensor (V2 only): detects RGB color channels and overall brightness, which is useful for correlating lighting conditions with temperature readings in sun-exposed spaces.
Motion and orientation sensors
The STMicro LSM9DS1 inertial measurement unit combines three sensors on one chip:
- Gyroscope: measures angular rate up to plus or minus 2,000 degrees per second
- Accelerometer: measures linear acceleration up to plus or minus 16g
- Magnetometer: measures magnetic field up to plus or minus 16 gauss
For environmental monitoring, the IMU data serves a supporting role. Accelerometer readings can detect physical disturbance to the monitoring station. Magnetometer data can flag nearby electromagnetic interference from new equipment. Gyroscope data confirms whether the board has been physically moved since calibration.
Display and input
The 8x8 RGB LED matrix operates as an RGB565 framebuffer, addressable per pixel. For monitoring, the matrix gives you a glanceable status indicator without needing a separate display. You can map temperature ranges to colors, show humidity as a bar graph, or flash the entire board red when a threshold is exceeded.
The five-button joystick (up, down, left, right, center press) maps to arrow keys and Enter, and can be used to cycle between sensor displays or acknowledge alerts.
The official sense-hat Python library provides access to every sensor, the LED matrix, and the joystick through a clean API. Installation is one command:
sudo apt install sense-hat

How to Read All Six Sensors and Display Data in Python
The sense-hat library wraps all I2C sensor communication into simple method calls. Here is a script that reads every environmental sensor and prints the results:
from sense_hat import SenseHat

sense = SenseHat()

temp = sense.get_temperature()
humidity = sense.get_humidity()
pressure = sense.get_pressure()

print(f"Temperature: {temp:.1f} C")
print(f"Humidity: {humidity:.1f} %")
print(f"Pressure: {pressure:.1f} mb")
The get_temperature() method reads from the humidity sensor (HTS221) by default. You can also call get_temperature_from_pressure() to read from the pressure sensor (LPS25HB) independently. Comparing the two readings helps identify heat bleed from the Pi's CPU, which warms the humidity sensor more than the pressure sensor because of its position on the board. A common correction is to average both readings or subtract a fixed offset, typically 1 to 3 degrees Celsius depending on the Pi model and CPU workload.
Reading motion and orientation data
The IMU methods return dictionaries with pitch, roll, and yaw values:
orientation = sense.get_orientation()
print(f"Pitch: {orientation['pitch']:.1f}")
print(f"Roll: {orientation['roll']:.1f}")
print(f"Yaw: {orientation['yaw']:.1f}")

accel = sense.get_accelerometer_raw()
print(f"X: {accel['x']:.2f}g  Y: {accel['y']:.2f}g  Z: {accel['z']:.2f}g")

compass = sense.get_compass()
print(f"North: {compass:.1f} degrees")
The raw accelerometer values are in Gs. A stationary board reads approximately 0g on X and Y, and 1g on Z (gravity). Any significant deviation from those baseline values means the board has been bumped or tilted.
Displaying readings on the LED matrix
The show_message() method scrolls text across the 8x8 display, but for environmental monitoring, color-coded pixels give faster visual feedback than scrolling text:
def temp_to_color(temp):
    if temp < 18:
        return (0, 0, 255)
    elif temp < 25:
        return (0, 255, 0)
    else:
        return (255, 0, 0)

color = temp_to_color(temp)
sense.clear(color)
This turns the entire LED matrix blue below 18 degrees Celsius, green between 18 and 25, and red above 25. For a richer display, use set_pixel(x, y, r, g, b) to create bar graphs or heatmaps that map multiple sensor readings onto the 64-pixel grid simultaneously. You could dedicate two rows to temperature, two to humidity, two to pressure, and two to accelerometer magnitude.
Continuous monitoring loop
A polling loop with file logging:
import time
import json
from datetime import datetime
from sense_hat import SenseHat

sense = SenseHat()

while True:
    reading = {
        "timestamp": datetime.utcnow().isoformat(),
        "temperature_c": round(sense.get_temperature(), 2),
        "humidity_pct": round(sense.get_humidity(), 2),
        "pressure_mb": round(sense.get_pressure(), 2),
        "accel_x": round(sense.get_accelerometer_raw()["x"], 3),
        "accel_y": round(sense.get_accelerometer_raw()["y"], 3),
        "accel_z": round(sense.get_accelerometer_raw()["z"], 3),
    }
    with open("sensor_log.jsonl", "a") as f:
        f.write(json.dumps(reading) + "
")

color = temp_to_color(reading["temperature_c"])
    sense.clear(color)
    time.sleep(30)
This writes one JSON line per reading every 30 seconds. The JSONL format works well for log ingestion because each line is independently parseable, and appending is safe even if the process is interrupted mid-write.


Persist your Sense HAT sensor logs in a shared workspace
Intelligent cloud storage, automatic file indexing once enabled, and an MCP endpoint your OpenClaw agent can write to directly.
How to Connect the Sensor Pipeline to an OpenClaw Agent
The polling loop above collects data, but it does not interpret it. A temperature that rises from 22 to 26 degrees over four hours means something different than the same rise in ten minutes. Static thresholds catch sudden spikes but miss gradual trends. This is where an AI agent adds value.
OpenClaw can execute shell commands, read and write local files, and orchestrate tasks through cloud-hosted LLMs like Claude or GPT-4. The Raspberry Pi handles sensor reading and local storage, while the agent sends recent readings to an LLM for contextual analysis. The Pi stays lightweight, the reasoning happens in the cloud, and the agent bridges the two.
How the workflow fits together
- The Python script reads the Sense HAT sensors on a fixed interval and writes JSONL entries to a local log file.
- The OpenClaw agent monitors the log file and, on each new batch of readings, sends the recent window of data to an LLM with a prompt that asks for trend analysis.
- The LLM returns a structured assessment: current conditions, trend direction, any anomalies, and recommended actions.
- If the assessment flags an alert condition, the agent sends a notification through a messaging channel. OpenClaw supports WhatsApp, Telegram, Slack, Microsoft Teams, Google Chat, and email for delivery.
- The agent uploads the structured assessment and raw readings to cloud storage for long-term retention.
This architecture separates concerns cleanly. The Sense HAT script stays simple and reliable. It does not need network access, API keys, or error handling for remote services. The OpenClaw agent handles orchestration, reasoning, and communication. If the LLM is unavailable, the sensor script keeps logging locally. If the Pi loses network connectivity, readings accumulate on disk until the agent can catch up.
What the agent can reason about
With six sensors feeding data, the agent has enough context to surface observations that a static threshold system would miss:
- Temperature and humidity together indicate heat index and condensation risk. If humidity exceeds 80% while temperature drops near the dew point, the agent can warn about moisture damage to electronics or stored materials.
- Barometric pressure trends over 6 to 12 hours correlate with incoming weather systems. A rapid drop in pressure often precedes storms. For outdoor or greenhouse monitoring, this gives advance warning to secure equipment.
- Accelerometer data detects physical disturbance. If the monitoring station is bumped or moved, the agent can flag that sensor placement may have changed, which affects reading accuracy and invalidates recent calibration.
- Magnetometer drift over time can indicate nearby electromagnetic interference from new equipment, which matters in industrial settings where motor starts and transformer loads shift throughout the day.
The agent does not need hard-coded rules for each of these scenarios. By sending raw readings along with historical context to the LLM, the model can identify patterns and generate alerts with explanations rather than just threshold violations. A message like "Temperature has risen 4 degrees over the last 3 hours while humidity dropped 12%, which is consistent with heating equipment running longer than usual" is more actionable than "Temperature exceeded 26C."
Storing Sensor Logs in a Cloud Workspace
Local JSONL files work for short-term storage, but they have clear limitations. The Raspberry Pi's SD card is a single point of failure. If the card corrupts, you lose your monitoring history. Sharing log files with team members means setting up SSH access or running a file server. And querying months of historical data from flat files requires custom scripts.
Cloud storage solves the durability problem. You have several options for storing sensor data from a Raspberry Pi:
- S3-compatible storage (AWS S3, MinIO, Backblaze B2): cheap and flexible for bulk log storage, but requires managing credentials, bucket policies, and lifecycle rules. No built-in search or collaboration.
- Google Drive or Dropbox: straightforward to set up with rclone, but designed for documents rather than structured log data. File sync conflicts can corrupt append-only log files when multiple writers target the same file.
- Fast.io: provides workspaces for agentic teams where agents and humans share the same files and intelligence layer. Upload sensor logs through the API or the MCP server, and the workspace indexes files automatically when Intelligence Mode is enabled. Fast.io offers a 14-day Business Trial, card required (see pricing).
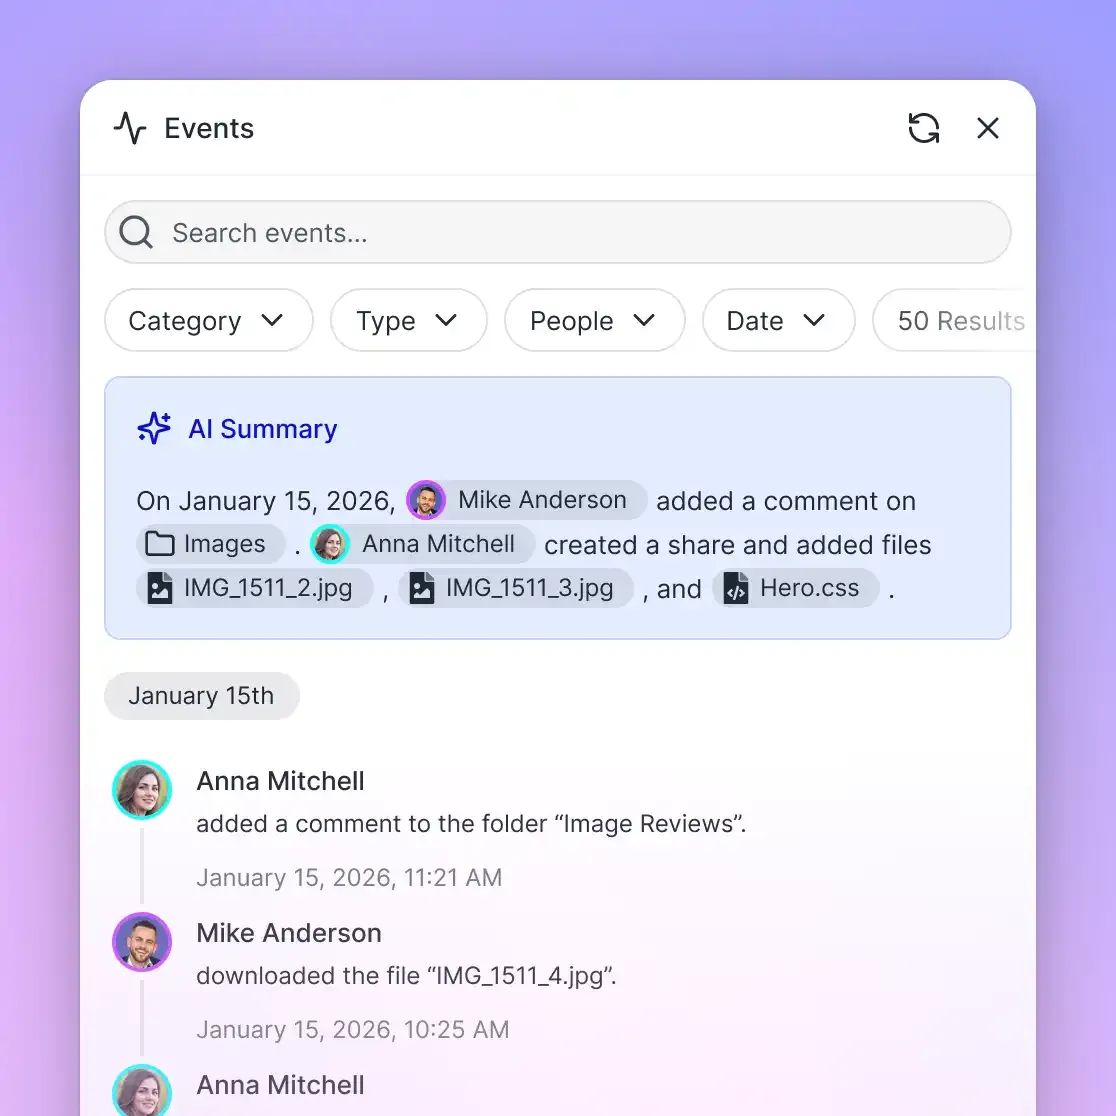
The practical advantage of Fast.io for sensor logs is the built-in RAG pipeline. Once log files land in a workspace with Intelligence Mode enabled, you can ask questions about the data in natural language: "What was the peak temperature last Tuesday?" or "Show me all humidity readings above 75%." The workspace returns answers with citations pointing to specific log entries. No separate vector database or search infrastructure needed.
For an OpenClaw agent, the Fast.io MCP server exposes workspace operations as tools that the agent can call directly. The agent can upload log files, create organized folder structures (one folder per day, or per sensor), and query historical data through the same interface it uses for everything else. If you need to hand off monitoring responsibilities to a colleague, workspace sharing lets you grant access without exposing raw API credentials.
Ownership transfer works well for contracted monitoring setups. An agent can build the entire workspace structure, populate it with log files and organized folders, then transfer ownership to the client. The agent retains admin access for ongoing maintenance while the client controls the workspace.
The combination of local Sense HAT collection and cloud storage creates a monitoring system that is both resilient and accessible. Local logging survives network outages. Cloud storage lets anyone review the data from any device. At roughly 200 bytes per JSONL reading, 30-second intervals produce about 576KB per day, so a cloud workspace holds decades of continuous data from a single Sense HAT. Storage will not be the bottleneck.
Sources
References used to verify factual claims in this guide.
-
The global IoT environmental sensor market will exceed $9.6 billion in 2026, growing at a 27.5% compound annual rate since 2021
-
Six onboard sensors including STMicro LPS25HB, HTS221, LSM9DS1, and TCS3400, originally developed for the Astro Pi program on the International Space Station
-
Sense HAT V2 retail price of $33 with sensor specifications including plus or minus 0.5C temperature accuracy and plus or minus 4.5% humidity accuracy
-
Python API methods get_temperature(), get_humidity(), get_pressure(), get_orientation(), and LED matrix methods
Frequently Asked Questions
What does the Raspberry Pi Sense HAT do?
The Sense HAT is an add-on board for the Raspberry Pi that includes six onboard sensors (gyroscope, accelerometer, magnetometer, temperature, humidity, and barometric pressure), an 8x8 RGB LED matrix, and a five-button joystick. It was originally designed for the Astro Pi program on the International Space Station and is used for environmental sensing, data visualization, and educational projects.
What sensors does the Sense HAT have?
The Sense HAT V2 includes an STMicro LPS25HB pressure and temperature sensor, an STMicro HTS221 humidity and temperature sensor, an STMicro LSM9DS1 inertial measurement unit (combining a gyroscope, accelerometer, and magnetometer), and a TCS3400 color and ambient light sensor. Together these provide six types of environmental and motion measurement from a single board.
How do I program the Sense HAT in Python?
Install the official library with sudo apt install sense-hat, then import it with from sense_hat import SenseHat. Create an instance with sense = SenseHat() and call methods like sense.get_temperature(), sense.get_humidity(), sense.get_pressure(), and sense.get_orientation(). The library also provides LED matrix methods like show_message(), set_pixel(), and clear().
Is the Sense HAT compatible with Raspberry Pi 5?
Yes. The Sense HAT works with any Raspberry Pi that has a 40-pin GPIO header, including the Raspberry Pi 5. If your Pi 5 has an active cooling fan installed, you may need standoff risers to create physical clearance between the fan and the HAT board.
How accurate is the Sense HAT temperature sensor?
The HTS221 humidity sensor provides temperature readings accurate to plus or minus 0.5 degrees Celsius. The LPS25HB pressure sensor provides a secondary temperature reading accurate to plus or minus 2 degrees. In practice, heat from the Raspberry Pi's CPU can raise readings by 1 to 3 degrees above ambient. Comparing readings from both sensors or mounting the Sense HAT away from the Pi with a ribbon cable improves accuracy.
Can the Sense HAT LED matrix display sensor data in real time?
Yes. The 8x8 RGB LED matrix can display sensor data as scrolling text with show_message(), as individual color-coded pixels with set_pixel(), or as a full-board color wash with clear(r, g, b). For monitoring, color-coding the matrix by sensor threshold gives a glanceable status indicator without needing a separate screen.
How much storage does continuous Sense HAT monitoring need?
At 30-second intervals logging temperature, humidity, pressure, and accelerometer data as JSON, each reading is roughly 200 bytes. That produces about 576KB per day or roughly 210MB per year. Storage is not a constraint for Sense HAT monitoring, whether you store locally on the Pi's SD card or upload to a cloud workspace.
Related Resources

Persist your Sense HAT sensor logs in a shared workspace
Intelligent cloud storage, automatic file indexing once enabled, and an MCP endpoint your OpenClaw agent can write to directly.