Best OpenClaw Skills for AI Assistant Deployment and Monitoring
Over 135,000 OpenClaw instances were found running without basic security controls in early 2026, yet most tutorials still stop at installation. Nine tools across hosting, observability, and metrics categories fill the gap between building an agent and running one safely in production.

Why Most OpenClaw Agents Stall Before Production
Over 135,000 exposed OpenClaw instances and a CVSS 8.8 vulnerability (CVE-2026-25253) hit the community in early 2026, right as OpenClaw crossed 250,000 GitHub stars. The incident exposed a painful gap: most developers know how to build an OpenClaw agent, but few have a repeatable path from working prototype to monitored production deployment.
The challenge breaks into two parts. First, you need somewhere to run the agent around the clock with container isolation, firewall rules, and TLS. Second, you need visibility into what the agent does once it is running: token costs, tool failures, latency breakdowns, and session health.
This guide covers nine tools across three categories: hosting platforms that handle infrastructure, observability skills that capture traces and costs, and metrics tools that expose health endpoints. Each entry includes strengths, limitations, and pricing so you can build a stack that fits your team and budget.
Related guides
- How to Use Claude Code Skills in ClineAccording to GitHub's Octoverse 2024 report, the number of developers building with generative AI on the platform...
- How to Install and Manage Cline Agent SkillsAI coding agents boost code volume by 180%, but shipped code rises by only 30%, showing a critical gap in development...
- Best OpenClaw Skills for AI Recipe Generation and Cooking AssistantsThe AI-generated recipe market passed $610 million in 2024, but most recipe apps still lock data behind closed...
- Best OpenClaw Skills for AI Writing Assistant ToolsVoltAgent's curated registry filtered ClawHub's 13,700+ entries down to roughly 5,200 production-grade skills, with...
- Best OpenClaw Skills for Building Custom AI AssistantsOpenClaw ships with 50+ bundled skills, but the ClawHub registry offers thousands more. This guide covers nine skills...
- Best OpenClaw Skills for Web ResearchWeb research skills let OpenClaw agents find and read information on the live web. Without them, your AI is stuck with...
More on this subject: OpenClaw Skills (109 guides)
How We Evaluated These Tools
We scored each tool against four criteria:
- Setup complexity: How many steps from zero to working? A three-command plugin install scores higher than a multi-day Kubernetes migration.
- Monitoring depth: Does it surface token costs, tool execution failures, and latency percentiles? Or just uptime?
- Cost: What does the tool itself cost, and does it help reduce LLM spend?
- OpenClaw compatibility: Is it a native plugin from the OpenClaw registry, a purpose-built hosting platform, or a general observability tool that requires custom instrumentation?
Every product listed below is real and currently available. Tools still in alpha are noted.
Hosting and Deployment Platforms
1. DigitalOcean 1-Click Deploy
A pre-configured Droplet image with OpenClaw installed, Docker isolation enabled, and firewall rules applied. One click provisions a hardened instance with a static IP and TLS reverse proxy.
Key strengths:
- Container isolation runs OpenClaw inside Docker, so a misbehaving agent only affects its own container
- Security defaults include fail2ban, non-root execution, device pairing, and unique gateway tokens
- Built-in update script keeps instances current in a single step
- Supports DigitalOcean Gradient AI models, open-source alternatives, and third-party providers like Anthropic
Limitations:
- No built-in observability beyond basic server metrics
- Scaling requires manual Droplet resizing or adding instances
Best for: Solo developers and small teams who want a production-ready environment without managing Docker or Kubernetes themselves.
Pricing: Starts at $12/month for the base Droplet tier.
2. OneClaw Managed Hosting
A fully managed OpenClaw platform with health monitoring, auto-restarts, and smart model routing. OneClaw handles server provisioning, SSL, and updates while you focus on configuring the agent.
Key strengths:
- Health checks run every 5 minutes with automatic restart on failure
- ClawRouters smart routing reduces LLM API costs by 40 to 60 percent according to OneClaw's documentation
- 40+ pre-built agent templates for common use cases
- automation hooks notifications with HMAC-SHA256 signing for real-time status alerts
Limitations:
- Less control over the underlying infrastructure compared to self-hosting
- Advanced monitoring (custom Prometheus dashboards) requires exporting data to your own stack
Best for: Teams that want zero-maintenance hosting with built-in cost optimization and a high availability SLA.
Pricing: $9.99/month for managed hosting. LLM API costs are paid directly to providers.
3. AgentBase
A one-click hosting platform with built-in MaaS (Monitoring as a Service), observability dashboards, and multi-instance support for teams running several OpenClaw agents.
Key strengths:
- Multi-instance management from a single control plane
- Built-in observability without additional plugins
- No DevOps experience required for deployment
Limitations:
- Less community documentation compared to DigitalOcean or self-hosted options
- Feature details beyond the one-click setup are limited in public docs
Best for: Teams running two or more OpenClaw agents who want centralized monitoring without assembling a separate observability stack.
Observability and Tracing Skills
4. ClawTrace by Epsilla
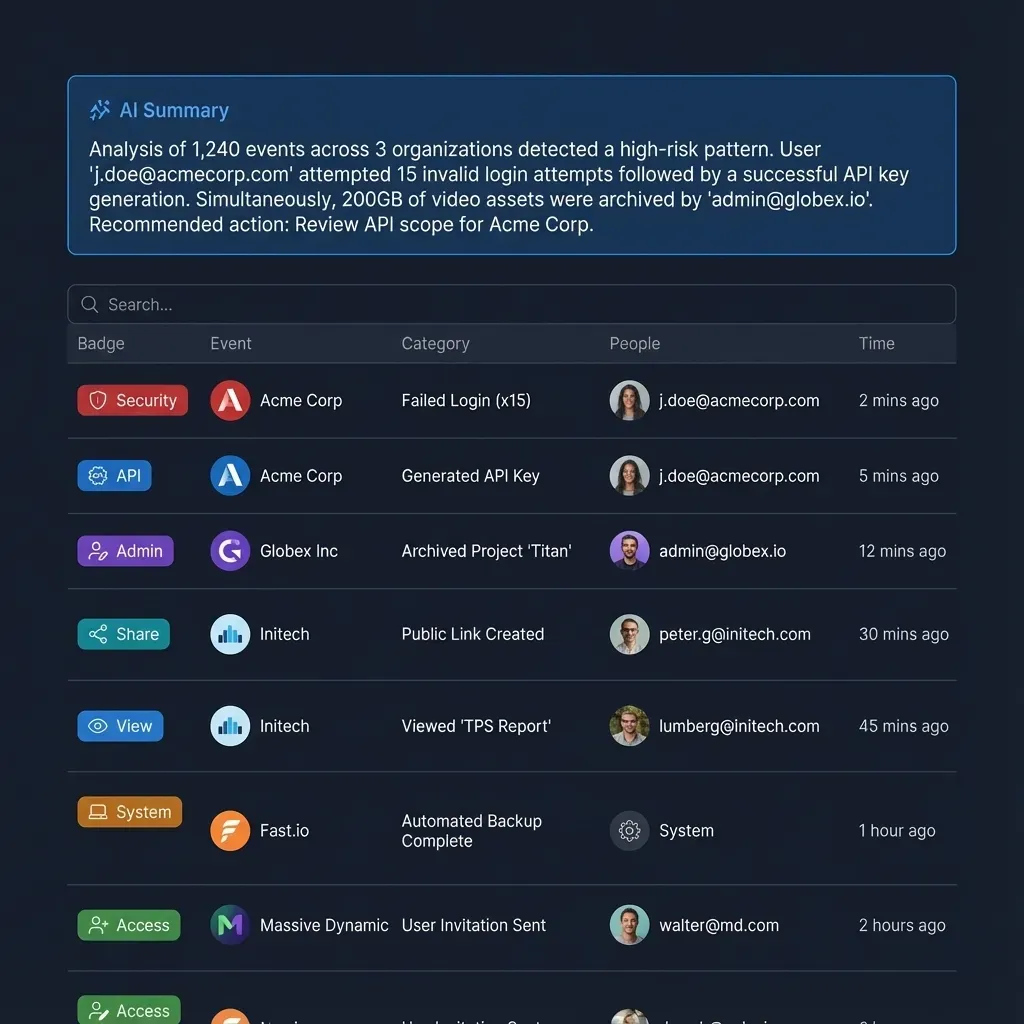
An observability control plane purpose-built for OpenClaw. ClawTrace installs as a plugin with zero code changes to existing agents and provides execution tracing, call graphs, and cost estimation across 80+ LLM models.
Key strengths:
- Execution Path view shows every LLM call, tool use, and sub-agent run with token counts and cost estimates
- Call Graph renders an interactive force-directed diagram of how agent components relate to each other
- Timeline View (Gantt chart) identifies bottlenecks by showing when each span ran and how long it took
- Cost tracking across models from OpenAI, Anthropic, Google, DeepSeek, and Mistral with cache-aware token differentiation
- Tracy AI analyst accepts plain English questions about your traces and translates them into diagnostic queries
Limitations:
- Adds less than 5ms per trace, though the TLS-encrypted gRPC channel requires outbound connectivity
- On-premise deployment is available but may require coordination with Epsilla's team
Best for: Teams that need deep tracing and cost attribution without modifying agent code.
Pricing: Free tier includes 100 credits. Paid tiers available for higher volume.
Install: Available through the OpenClaw plugin registry. Add the ClawTrace plugin, run the setup wizard, and restart your gateway.
5. Opik by Comet
An Apache 2.0 open-source observability platform with a native OpenClaw plugin. Opik traces every agent interaction, including LLM calls, tool execution, memory recall, and sub-agent delegation.
Key strengths:
- Full conversation threading follows requests through multi-step reasoning, tool calls, and scheduled heartbeat cycles
- Per-request, per-model cost breakdowns address the "mystery token spend" problem that grows as context assembly accumulates
- Automated LLM-as-a-judge evaluation catches hallucination, relevance drift, and context precision issues without manual review
- Open source (Apache 2.0), so you can self-host the entire backend
Limitations:
- Managed version requires an Opik API key from Comet
- Automated evaluation metrics run on your LLM provider, adding minor inference cost
Best for: Teams that want open-source observability with automated quality evaluation built in.
Pricing: Free self-hosted. Managed cloud pricing available through Comet.
Install: Available through the OpenClaw plugin registry. Add the Opik plugin, configure your API key, and restart the gateway.
6. diagnostics-otel (OpenTelemetry Export)
The official OpenClaw OpenTelemetry plugin exports traces, metrics, and logs over OTLP to any compatible backend: SigNoz, Grafana Cloud, Datadog, or your own collector.
Key strengths:
- Collects token usage, cost, context size, run duration, message-flow counters, queue depth, and session state
- Traces span model calls, tool execution, and automation hooks processing so you can pinpoint whether latency comes from the LLM or a tool
- Works with any OTLP-compatible backend, avoiding vendor lock-in
- Configurable trace sampling rates (0.0 to 1.0) and flush intervals (minimum 1000ms)
Limitations:
- Requires an OpenTelemetry Collector or compatible backend to receive data
- Building Grafana dashboards from raw OTLP data takes initial configuration work
Best for: Teams already running Grafana, SigNoz, or another OTLP backend who want to add OpenClaw metrics without a new vendor.
Pricing: Free (official OpenClaw plugin). Backend costs depend on your chosen provider.


Give your production agents a persistent workspace
Fast.io provides persistent storage, a remote MCP server with a consolidated toolset, and audit trails for every file operation. Start with a 14-day Business Trial.
Metrics, Health Checks, and Runtime Security
7. diagnostics-prometheus
The official OpenClaw Prometheus plugin exposes 40+ metrics in standard Prometheus exposition format on the gateway port. It covers model operations, tool execution, messaging, session state, system health, and voice events.
Key strengths:
- 40+ metrics with labels for model, provider, channel, and outcome
- Series cap at 2,048 prevents cardinality explosion, with a counter tracking dropped series
- No raw identifiers (runId, sessionKey) are emitted, keeping the metrics endpoint safe for external access
- Direct Prometheus scraping with Gateway operator authentication
Limitations:
- Requires a running Prometheus instance to scrape the endpoint
- Scrape configuration must include Gateway auth credentials (bearer token)
Best for: SRE teams with existing Prometheus and Grafana infrastructure who want native OpenClaw metrics without building custom exporters.
Pricing: Free (official plugin). The scrape endpoint is available at GET /api/diagnostics/prometheus on the gateway's default port.
OpenClaw also exposes two built-in health probes without any plugin. /health returns {"ok": true} if the process is alive. /ready checks whether messaging channels (Telegram, Discord, and others) are actually connected and returns a 503 if any channel drops. Both listen on the gateway's default port and work with standard container orchestration liveness and readiness checks.
8. NVIDIA NemoClaw
A security and governance layer that wraps around OpenClaw, adding kernel-level sandboxing, an out-of-process policy engine, and a privacy router for model selection. NemoClaw helps teams move from prototype to governed deployment with about 500 lines of plugin code on top of an existing OpenClaw installation.
Key strengths:
- Deny-by-default sandbox blocks network access, filesystem paths, process execution, and privilege escalation unless explicitly permitted
- Out-of-process policy engine runs in a separate trust boundary, so a compromised agent cannot modify its own permission checks
- Privacy router intercepts inference calls and routes sensitive data to local Nemotron models while sending complex reasoning tasks to cloud providers
- Single-command installation that does not require changes to existing agent code
Limitations:
- Full Privacy Router functionality requires NVIDIA GPUs for local model inference
- Currently in early-stage alpha with no published performance benchmarks as of June 2026
- No independent security audits completed yet
Best for: Enterprise teams on NVIDIA hardware who need governance controls, data residency policies, and audit-grade logging.
Pricing: Free and open source. Requires NVIDIA GPU hardware for local model routing.
9. openclaw-operator (Kubernetes)
A community-built Kubernetes operator that manages OpenClaw agent lifecycle with network isolation, secret management, persistent storage, and health monitoring.
Key strengths:
- Handles StatefulSet provisioning, PVC backup to S3 via CronJob, and rolling config updates
- Uses Kubernetes Server-Side Apply for safe coexistence with GitOps controllers like FluxCD and ArgoCD
- works alongside Prometheus for both container-level and agent-level metrics
- Helm chart available for declarative deployment
Limitations:
- Requires an existing Kubernetes cluster, which adds operational complexity
- More setup effort than managed hosting options
Best for: Platform teams running Kubernetes who want to manage OpenClaw agents alongside other workloads with standard GitOps tooling.
Pricing: Free and open source.
Choosing the Right Stack
The right combination depends on your team size and existing infrastructure.
Solo developers or small teams: Start with DigitalOcean 1-Click Deploy ($12/month) or OneClaw ($9.99/month) for hosting. Add ClawTrace or Opik for observability. This gives you a running agent with cost tracking and trace visibility for under $15/month total.
Mid-size teams with existing infrastructure: If you already run Prometheus and Grafana, install diagnostics-prometheus and diagnostics-otel to pipe OpenClaw metrics into your existing dashboards. Host on a VPS or containerized setup you control.
Enterprise and compliance-driven teams: Combine openclaw-operator for Kubernetes deployment with NemoClaw for governance controls. Add diagnostics-prometheus for cluster-wide metrics and ClawTrace for per-agent tracing.
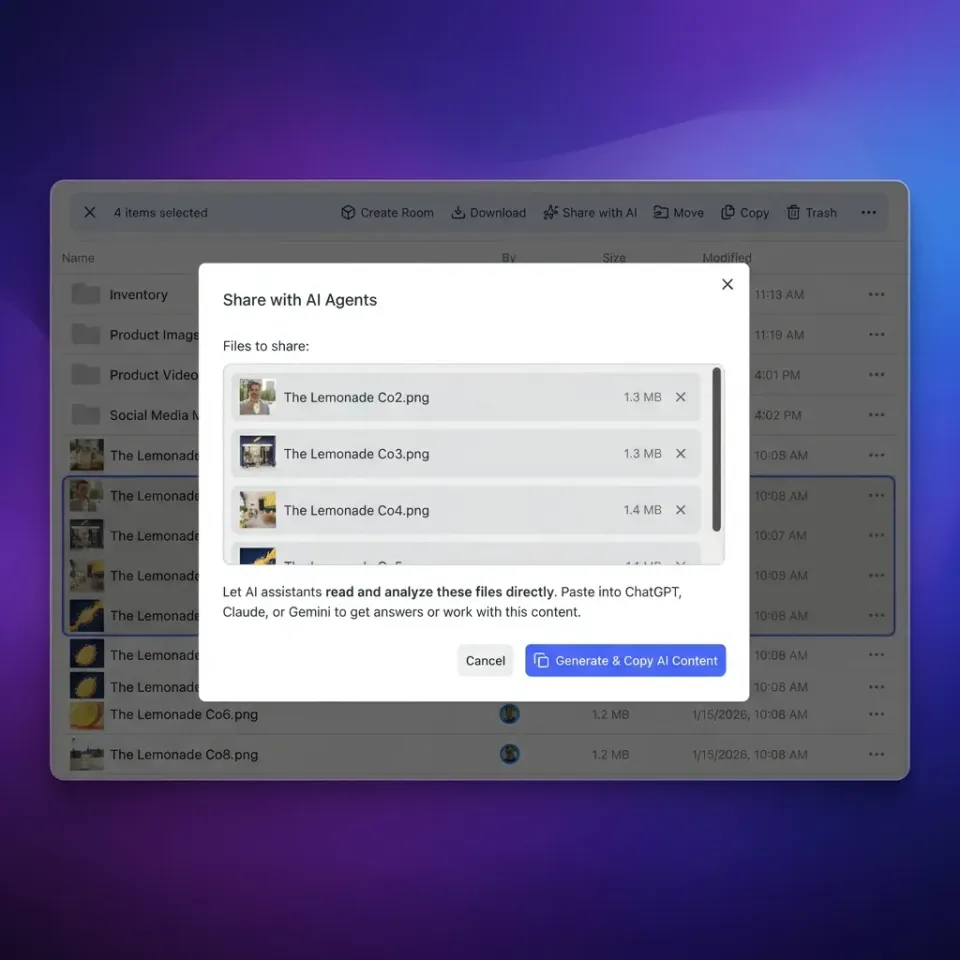
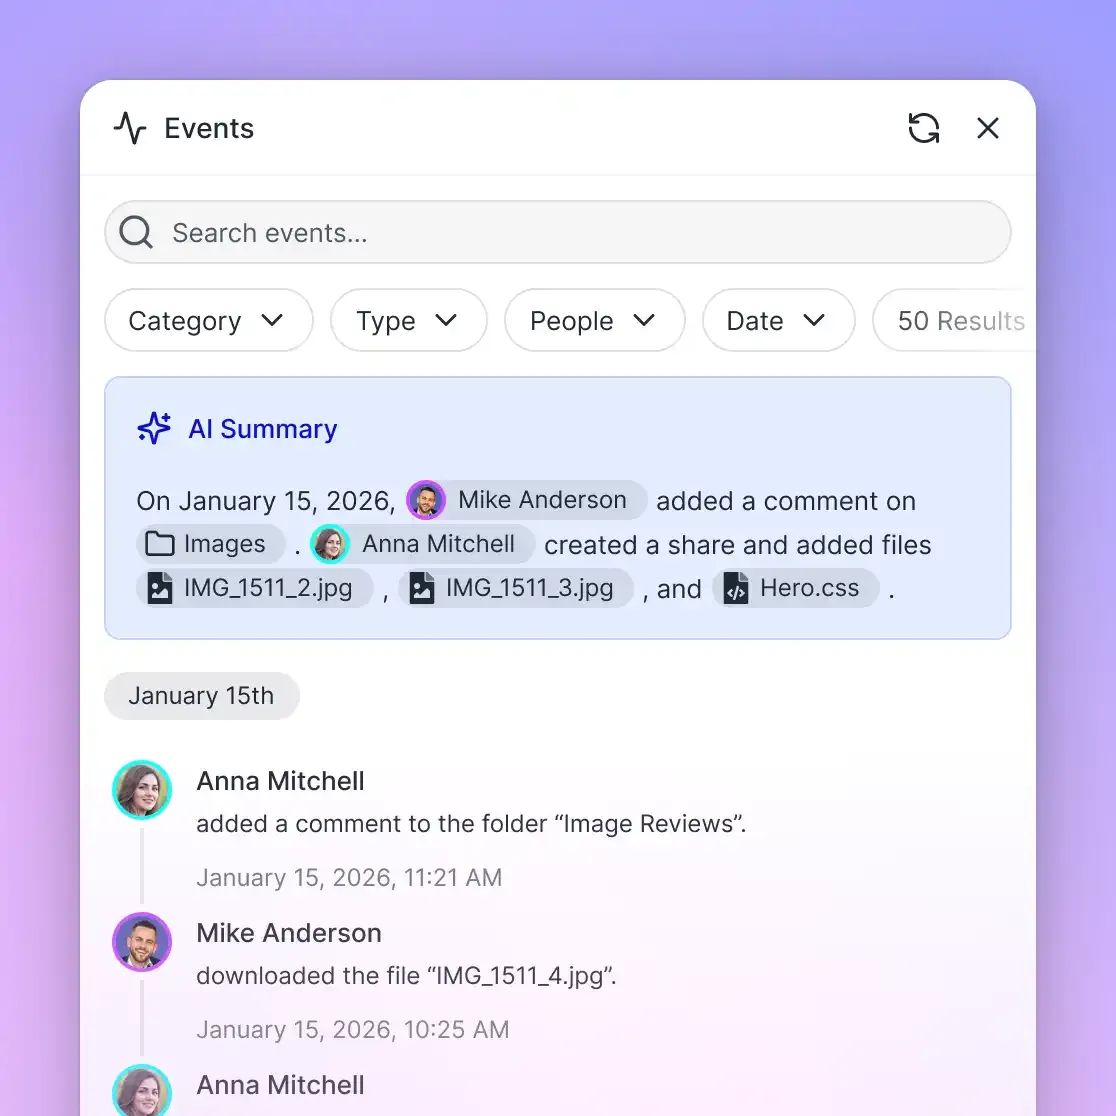
Whatever stack you choose, production agents need persistent file storage for outputs, logs, and handoff artifacts. Local disk works for prototyping, but anything running 24/7 should write to a dedicated workspace. Options include S3 buckets, Google Drive, or a purpose-built agent workspace like Fast.io. Fast.io provides persistent storage, remote MCP server access with a consolidated toolset, and a detailed activity log of every file operation your agent performs. Once Intelligence is enabled for the workspace, stored files are indexed for semantic search without a separate vector database. When the agent finishes a project, ownership transfer hands the workspace to a human while the agent keeps admin access.
Start with one hosting platform and one observability skill. You can add Prometheus metrics or Kubernetes orchestration later as your agent count grows.
Sources
References used to verify factual claims in this guide.
-
Over 135,000 exposed OpenClaw instances and CVE-2026-25253 (CVSS 8.8)
-
DigitalOcean 1-Click Deploy starts at $12/month
-
OneClaw $9.99/month with 99.9% SLA and 40-60% API cost reduction via ClawRouters
-
ClawTrace adds less than 5ms per trace with cost tracking across 80+ models
-
diagnostics-prometheus exports 40+ metrics with 2,048 series cap
-
NemoClaw is approximately 500 lines of plugin code
Frequently Asked Questions
How do you deploy an OpenClaw agent to production?
The fast path is a managed hosting platform. DigitalOcean 1-Click Deploy provisions a hardened Droplet with Docker isolation and TLS in one step for $12/month. OneClaw offers fully managed hosting at $9.99/month with health checks and auto-restarts. For Kubernetes environments, the openclaw-operator handles StatefulSet provisioning, secret management, and PVC backups.
What tools monitor OpenClaw agent health?
OpenClaw exposes two built-in health probes on its gateway: /health for liveness and /ready for channel connectivity. For deeper monitoring, the diagnostics-prometheus plugin exports 40+ metrics covering model operations, tool execution, and session state. ClawTrace and Opik provide full trace-level observability with cost tracking and bottleneck identification.
Can OpenClaw agents send metrics to Grafana?
Yes, through two official paths. The diagnostics-prometheus plugin exposes a Prometheus-compatible endpoint that Grafana can scrape directly. The diagnostics-otel plugin exports traces, metrics, and logs over OTLP, which you can route through an OpenTelemetry Collector into Grafana Cloud or a self-hosted Grafana instance.
What is the cheapest way to host an OpenClaw agent?
OneClaw managed hosting starts at $9.99/month with built-in health monitoring and auto-restarts. DigitalOcean 1-Click Deploy starts at $12/month for a hardened Droplet. Both options add LLM API costs on top, which you pay directly to providers like OpenAI, Anthropic, or Google. OneClaw's ClawRouters smart routing can reduce those API costs by 40 to 60 percent.
How does ClawTrace differ from the built-in OpenClaw diagnostics plugins?
The built-in diagnostics-prometheus and diagnostics-otel plugins export raw metrics and traces to external backends like Grafana or SigNoz. ClawTrace adds a purpose-built analysis layer on top: interactive call graphs, timeline views for bottleneck detection, cost estimation across 80+ models, and an AI analyst that answers plain English questions about your traces. It installs as a plugin with zero code changes.
Related Resources

Give your production agents a persistent workspace
Fast.io provides persistent storage, a remote MCP server with a consolidated toolset, and audit trails for every file operation. Start with a 14-day Business Trial.