7 Best OpenClaw Tools for AI Report Generation and Dashboarding
ClawHub lists 28 Data & Analytics skills, but wiring them into an agent that generates and delivers reports end to end takes trial and error. This guide ranks 7 OpenClaw tools that cover the full reporting pipeline: querying databases, building charts, formatting spreadsheets, and sharing finished reports with your team.

Why 28 Analytics Skills Still Leave a Reporting Gap
ClawHub's Data & Analytics category lists 28 skills as of May 2026, covering everything from GA4 connectors to CEO performance scoring. That is more than enough raw capability. The problem is that no single skill handles the full reporting pipeline, and the guides that do exist focus on standalone BI platforms like Tableau or Looker rather than on wiring skills into an autonomous OpenClaw agent.
The difference matters. Dashboard tools assume a human clicks through filters and exports PDFs. An OpenClaw reporting workflow runs unattended: the agent queries a database, builds charts, formats the output, and delivers the finished report to Slack, email, or a shared workspace.
The 7 tools below cover the full range of reporting use cases:
- Client reports: data-analyst (SQL-to-chart pipelines)
- Website analytics: ga4-analytics (automated traffic summaries)
- Visualization: ChartGen (30+ chart types from natural language)
- Data transformation: csv-pipeline (CSV and JSON processing)
- Spreadsheet automation: Skywork Excel (formatted workbooks with formulas)
- Daily digests: daily-report (recurring metric summaries)
- Storage and delivery: Fastio (indexing, search, and branded sharing)
Each entry includes the install command, verified strengths and limitations, and where it fits in a production reporting workflow.
data-analyst: Full-Stack Reporting From SQL to Charts
The data-analyst skill by oyi77 is the most complete reporting tool on ClawHub. It turns your OpenClaw agent into a data analyst that queries databases, processes spreadsheets, runs statistical analysis, and generates visualizations from a single natural language prompt.
The skill supports SQL execution against relational databases, including BigQuery and Snowflake for warehouse-scale queries. For local work, it handles CSV and Excel file parsing, data cleaning, descriptive and inferential statistics, and chart creation using Python libraries like Matplotlib and Plotly. You can tell your agent to "pull last quarter's revenue by region and create a bar chart comparing it to the prior quarter" and it runs the full pipeline without switching tools.
Pros:
- Handles the entire reporting chain: data ingestion, analysis, visualization, and export.
- Supports SQL databases, CSV, Excel, and Google Sheets as input sources.
- Generates charts locally using Matplotlib and Plotly without external API dependencies.
Cons:
- Requires database connection strings configured locally for SQL sources.
- Chart output is static images (PNG), not interactive dashboards.
Best For: Teams that need one skill to replace the manual "download CSV, write query, make chart" cycle.
Pricing: Free (MIT-0 license).
GA4 Analytics: Website Traffic Reports on Demand
The ga4-analytics skill by adamkristopher connects your agent directly to Google Analytics 4, Search Console, and the Indexing API. Instead of navigating the GA4 dashboard manually, you ask your agent for a traffic summary and get a structured response with the actual numbers.
The skill includes over 30 API functions covering page performance, traffic sources, user demographics, real-time visitors, search queries, and SEO metrics. You can set custom date ranges, apply filters, sort by any dimension, and get aggregated results. A typical prompt: "Compare this week's organic traffic to last week and flag any pages with a drop over 20%."
ClawHub also lists a separate google-analytics-api skill by rich-song that focuses on raw API access with managed authentication. The ga4-analytics skill is the better fit for reporting because it adds natural language interpretation and summary generation on top of the raw data.
Pros:
- Covers GA4, Search Console, and Indexing API in one skill.
- Natural language queries replace manual dashboard navigation.
- Custom date ranges, filtering, and aggregated reporting built in.
Cons:
- Requires Google Analytics Data API credentials configured locally.
- Limited to Google's analytics ecosystem.
Best For: Marketing teams and agencies that need automated weekly traffic summaries without opening the GA4 interface.
Pricing: Free (MIT-0 license).
ChartGen: 30+ Visualization Types From Natural Language
ChartGen fills the gap between raw data and presentation-ready visuals. While data-analyst generates charts through Matplotlib, ChartGen specializes in visualization with 30+ chart types across six categories: comparison (bar, grouped bar, stacked bar), trends (line, area, sparkline), composition (pie, donut, treemap), distribution (scatter, bubble, histogram, box plot), specialized (funnel, waterfall, Gantt, radar), and advanced (heatmap, combo, Sankey, gauge). Install it from ClawHub and configure an API key from ChartGen.ai.
The skill accepts XLSX, CSV, and JSON files as input and exports high-resolution PNG and SVG images. You describe the chart in plain English: "Create a waterfall chart showing monthly revenue changes, highlighting the net total." ChartGen handles layout, colors, and labeling automatically.
For client reports, the quality difference between a Matplotlib bar chart and a ChartGen Sankey diagram is the difference between "the data is there" and "the data tells a story." If your reports go to executives or external clients, that quality gap matters.
Pros:
- 30+ chart types, including specialized formats (Sankey, Gantt, gauge) that most tools hide behind premium tiers.
- Outputs publication-quality PNG and SVG.
- MIT-0 licensed and security-verified as benign on ClawHub.
Cons:
- Requires an API key from ChartGen.ai (free credits for new users, paid tiers for higher volume).
- External API call adds latency compared to local Matplotlib rendering.
Best For: Client-facing reports where chart quality matters. Waterfall, Sankey, and Gantt charts are difficult to produce with Matplotlib alone.
Pricing: Free tier with credits. Paid plans for higher volume.


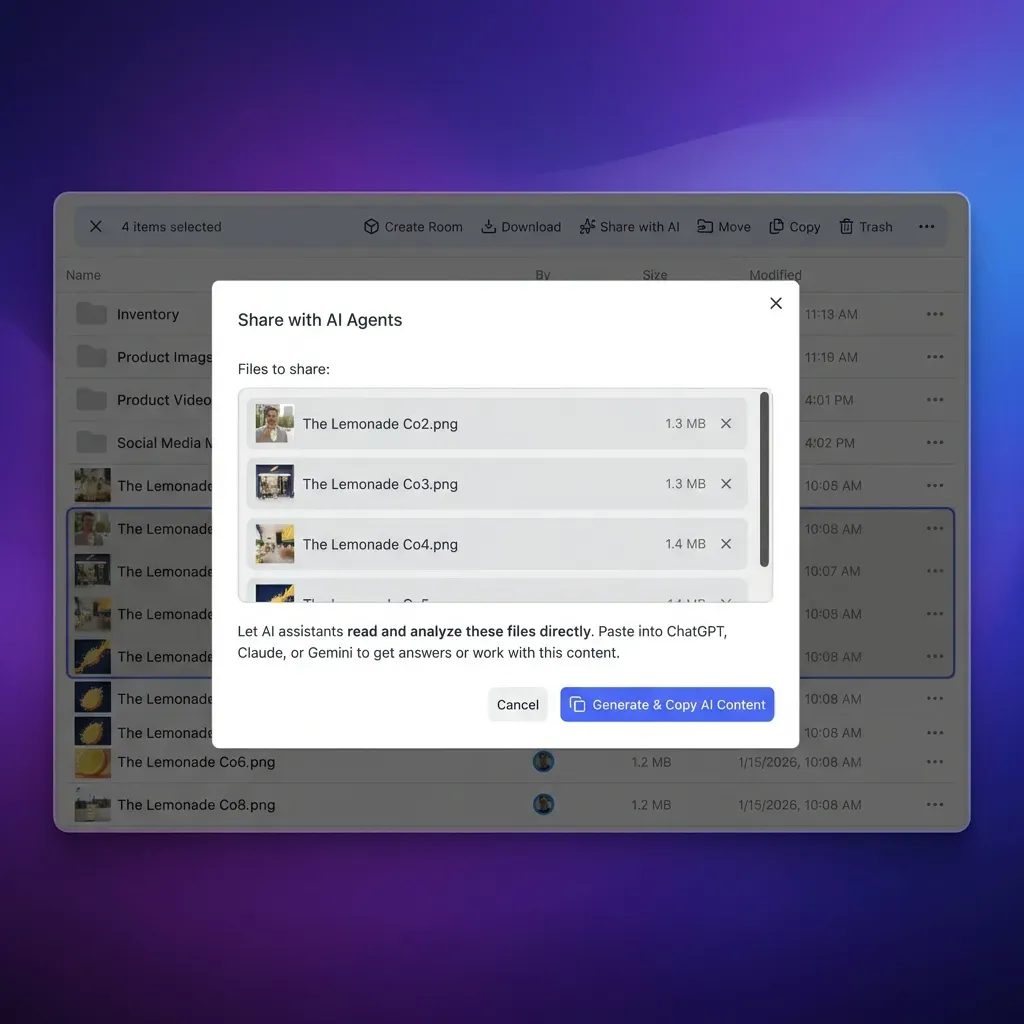
Search your reports with a question, not a filename
Fastio indexes every file your agent uploads. Ask questions, get answers with citations, and share reports through branded links. generous storage, no credit card.
How to Automate Spreadsheet Reports and Daily Digests
Three more ClawHub skills cover the spreadsheet and scheduling side of reporting. Together, they handle the workflow that starts with a raw CSV export and ends with a formatted report delivered on schedule.
csv-pipeline: Transform Raw Data Exports
The csv-pipeline skill by gitgoodordietrying processes, transforms, analyzes, and reports on CSV and JSON data. It handles the middle of the reporting chain: filtering rows, aggregating columns, computing derived metrics, and converting results into structured tables. If your workflow starts with a database export or API dump, this skill cleans and reshapes the data before you pass it to a visualization tool.
Pros:
- Handles both CSV and JSON inputs.
- Supports filtering, aggregation, and derived column computation.
Cons:
- Limited to tabular data formats.
Best For: Cleaning and reshaping raw data exports before visualization or delivery.
Pricing: Free (MIT-0 license).
Skywork Excel: AI-Powered Spreadsheet Reports
Skywork provides AI-powered spreadsheet operations through its open-source skills package. The skill creates Excel files with data, formulas, and embedded charts, analyzes existing spreadsheets, and generates HTML analysis reports.
GitHub: github.com/SkyworkAI/Skywork-Skills
These skills work with any agent that supports the SKILL.md standard, including OpenClaw, Claude Code, and Codex CLI. For recurring reports, pair Skywork Excel with OpenClaw's daemon mode to auto-generate weekly KPI workbooks on a schedule.
Pros:
- Creates Excel files with working formulas and charts, not flat data dumps.
- Cross-agent compatible (OpenClaw, Claude Code, Codex CLI).
Cons:
- Requires the Skywork Skills package installed locally.
Best For: Finance and operations teams that need Excel-native reports with formulas and pivot-ready tables.
Pricing: Free (open source).
daily-report: Automated Progress Tracking
The daily-report skill by visualdeptcreative tracks progress, reports metrics, and maintains memory across sessions. It handles the "daily standup summary" use case: the agent collects activity data, compiles a digest, and stores it for historical comparison. Combined with OpenClaw's daemon mode, it runs on a schedule without manual prompting.
Pros:
- Persistent memory for trend tracking across sessions.
- Lightweight compared to full analytics skills.
Cons:
- Focused on daily summaries, not deep analysis or visualization.
Best For: Teams that want automated daily metric digests without building a full reporting pipeline.
Pricing: Free (MIT-0 license).
Fastio: Persist, Index, and Share Agent-Generated Reports
Every skill above produces output: charts, spreadsheets, summaries. The question is where that output lives after the agent finishes. Local file systems work for a solo developer, but teams need reports accessible to people who were not at the terminal when the agent ran.
Fastio provides the storage and delivery layer for agent-generated reports. Files uploaded to a workspace are automatically indexed by Intelligence Mode, which means your team can search reports by meaning, not just filename. Ask "what was our conversion rate in April?" and get an answer citing the specific report. The Fastio skill on ClawHub connects your agent to the platform's workspace and sharing tools.
The skill exposes 19 consolidated tools covering file uploads, workspace management, RAG-powered AI chat, branded sharing, task tracking, and audit logs. Agents connect via the MCP server using Streamable HTTP at /mcp or legacy SSE at /sse.
A practical workflow: your OpenClaw agent runs data-analyst to query a database, uses ChartGen to build visualizations, then uploads everything to a Fastio workspace. Intelligence Mode indexes the files immediately. Your team searches, reads, and comments on the reports through the web UI. When the project wraps, you transfer workspace ownership to the client.
For scheduling, pair Fastio with OpenClaw's daemon mode or an n8n workflow to generate and deliver reports on a recurring basis. n8n handles the trigger (cron schedule, automation hooks, form submission), calls OpenClaw for the analysis, and routes the finished report to Fastio for permanent storage and sharing.
Pros:
- Built-in RAG indexes reports for semantic search and AI-powered Q&A.
- Branded sharing lets you deliver reports with your own domain and logo.
- 19 MCP tools cover the full lifecycle: upload, organize, search, share, audit.
Cons:
- Cloud storage. If reports contain data that must stay on your network, you will need an on-premises alternative like S3 or MinIO.
Best For: Teams and agencies that generate reports for clients and need a searchable, shareable repository with audit trails.
Pricing: Business Trial (50GB storage, included credits, 5 workspaces, no credit card required).
How to Choose the Right Reporting Stack
The right combination depends on where your data lives and who reads the finished report.
- For full-pipeline reporting from database to chart, start with data-analyst. It handles SQL, spreadsheets, statistics, and basic visualization in one skill.
- For website analytics, add ga4-analytics to pull traffic data directly from GA4 without touching the dashboard.
- For presentation-quality charts, use ChartGen when your audience is clients or executives. Its 30+ chart types cover formats that Matplotlib cannot produce easily.
- For spreadsheet-native reports, combine csv-pipeline for data cleaning with Skywork Excel for formatted workbooks with working formulas.
- For daily digests, daily-report tracks metrics across sessions and runs on a schedule via daemon mode.
- For storage, search, and delivery, Fastio indexes reports for semantic search and lets you share them through branded links.
Most effective reporting agents combine two or three of these skills. A common stack: data-analyst for the analysis, ChartGen for the visuals, and Fastio for storage and delivery. That gives you an agent that can produce a complete client report from a single prompt and put it somewhere your team and clients can find it.
Frequently Asked Questions
How do I generate reports with OpenClaw?
Install a reporting skill like data-analyst from ClawHub, configure your data source connection, and describe the report you want in natural language. The agent queries your data, runs the analysis, and produces the output. For recurring reports, run OpenClaw in daemon mode with a schedule.
What OpenClaw skills create dashboards?
ChartGen produces 30+ chart types including specialized formats like Sankey diagrams and gauge charts. The data-analyst skill generates Matplotlib and Plotly charts from SQL or CSV data. For live web analytics, ga4-analytics pulls data directly from Google Analytics 4 and returns structured summaries.
Can OpenClaw automate weekly client reports?
Yes. Combine a data skill (data-analyst or csv-pipeline) with a visualization skill (ChartGen) and a storage layer (Fastio). Run the agent on a weekly schedule using daemon mode or trigger it through an n8n workflow. The agent generates the report and uploads it to a shared workspace where your client accesses it through a branded link.
Are OpenClaw reporting skills safe to use?
ClawHub scans published skills for malicious code, and each skill page shows a security rating. Stick to skills rated as benign with high confidence. All seven tools in this guide are open source or have published security ratings. Review the SKILL.md file before installing any skill, and avoid skills from unknown authors without security verification.
Do I need Python to use these reporting tools?
No. OpenClaw skills accept natural language commands. You describe what you want, and the agent picks the right tool and runs it. The data-analyst and csv-pipeline skills execute Python internally, but you do not need to write any code yourself.
Related Resources

Search your reports with a question, not a filename
Fastio indexes every file your agent uploads. Ask questions, get answers with citations, and share reports through branded links. generous storage, no credit card.