How to Use Data Room Analytics and Reporting to Close Deals Faster
Data room analytics track how participants interact with documents during due diligence, giving deal teams visibility into buyer engagement, document interest, and overall deal momentum. This guide explains the key metrics available in virtual data rooms, how to interpret engagement patterns strategically, and how to turn raw activity data into actionable deal intelligence.

What Data Room Analytics Actually Measure
Data room analytics go beyond simple access logs. While early virtual data rooms only told you whether someone opened a document, modern platforms track granular engagement signals that reveal how participants interact with your materials at the page level.
The core metrics fall into a few categories:
- Access metrics: who logged in, when, how often, and from where
- Document-level engagement: which files were opened, downloaded, or printed
- Page-level depth: time spent on individual pages within a document, return visits to specific sections, and reading sequence
- Q&A activity: questions submitted, response times, and reopen rates
- Aggregate patterns: total time in the room, documents covered as a percentage of total, and activity trends over time
Page-level analytics are where the real insight lives. Knowing that an investor spent 12 minutes on your lease agreements and kept returning to the rent escalation clauses on pages 7 through 9 tells you far more than knowing they "viewed" the file. That pattern signals a specific concern you can address proactively in your next conversation.
Most VDR platforms present this data through dashboards with filterable views by user, document, time period, and user group. The better ones let you export raw data as CSV for custom analysis or board reporting.
Helpful references: Fastio Workspaces, Fastio Collaboration, and Fastio AI.
Key Metrics and What They Tell You
Not all analytics carry equal weight. Some metrics are noise. Others predict deal outcomes. Here is how to read the signals that matter.
Heatmap Depth
Heatmap analytics show where viewers spend their time. The most revealing pattern is sustained attention on valuation-critical documents: unit economics, customer cohorts, revenue bridges, and cap tables. When a buyer revisits the same financial model three times in a week, they are building their own model around yours. That is a strong buying signal.
Watch the sequence, too. A viewer who moves from a cohort analysis to churn metrics to pricing history is following a logical diligence thread. Sharp pivots between related financial documents often precede term sheet requests.
Q&A Velocity and Reopen Rates
The Q&A module is a deal thermometer. Track two numbers: median answer time by category, and the reopen ratio. A reopen ratio above 15% in any single category, where buyers keep pushing back on your answers, signals an unresolved risk that could stall the deal.
Answer latency matters on your side, too. If your team takes more than 48 hours to respond after a management meeting, buyers read that as internal misalignment or a lack of preparedness.
Role-Weighted Engagement
Who is logging in tells you as much as what they are reading. Early activity from operators and integration leads, rather than just financial analysts, indicates serious intent. When a buyer's CTO starts reviewing your technology documentation alongside their M&A team, that buyer is thinking about post-close execution, not just valuation.
Heavy external advisor logins without corresponding principal activity can signal timeline delays. The buyer may be outsourcing diligence rather than driving it internally.
Progress Curves
Plot each bidder's cumulative document coverage over time. Genuine buyers produce an S-curve: slow initial exploration, rapid middle-phase consumption of core materials, then a plateau as they move toward decision. Flat curves, where a party logs in occasionally but never builds momentum, indicate low priority or a bid that exists mainly to create competitive pressure.
Turning Analytics Into Deal Strategy
Raw data is only useful if it changes what you do. Here are specific ways to translate analytics into action during a live deal.
Prioritize Follow-Up by Engagement
After opening a data room to multiple bidders, rank them by engagement depth, not just stated interest. A buyer who has reviewed 80% of your documents and asked detailed questions about customer contracts is more advanced than one who expressed enthusiasm in a meeting but has only opened the teaser deck.
Use this ranking to allocate your team's time. Management presentations, site visits, and expert sessions should go first to the bidders whose analytics show genuine diligence momentum.
Address Concerns Before They Surface
If analytics show a buyer spending disproportionate time on a specific area, like employment agreements or IP assignments, prepare talking points before your next call. Proactive disclosure builds trust and removes friction from the process.
One practical approach: set up weekly analytics reviews where your deal team examines the top three documents by view time for each active bidder. Map those documents to potential concerns, then draft preemptive responses or supplementary materials.
Time Your Process Letters
Process milestones like bid deadlines and exclusivity windows work better when they align with buyer readiness. If analytics show that two of your three finalists have covered 90% of the room while the third has barely started, you have data to support either extending the timeline selectively or advancing with the engaged parties.
Identify Deal Risks Early
Sudden drop-offs in activity are warning signs. If a bidder goes from daily logins to silence after reviewing your financial pack, something changed on their end, whether it is a funding issue, a competing priority, or a concern about what they found. A quick check-in call is better than waiting for a formal withdrawal.
Similarly, watch for unusual download spikes. A buyer downloading every document in the room at once may be preparing for an internal review committee, which is positive, or may be archiving before disengaging, which is not. Context from your relationship with that buyer helps interpret the signal.


Track Document Engagement Across Your Deal Room
Fastio portals give your team analytics on viewer activity, document access, and engagement patterns. Audit trails, branded portals, and AI-powered document search included. Start 14-day trial, no credit card required. Built for data room analytics and reporting workflows.
Reports You Should Generate at Each Deal Stage
Different stages of a transaction call for different reports. Here is a practical framework.
Pre-Launch
Before opening the room, establish your baseline. Document which files are in the room, how they are organized, and what your expected engagement benchmarks look like based on deal type. An M&A process with five bidders looks different from a fundraise with 30 investor contacts.
Week One
Generate a first-access report showing which invitees have logged in and which have not. Follow up with non-accessing parties. A bidder who signed an NDA but has not entered the room within five business days may need a nudge, or may not be serious.
Active Diligence
Weekly engagement summaries are the workhorse report during active diligence. Include:
- Total logins and unique users per bidder group
- Documents viewed and percentage of room coverage
- Average time per session
- Top 10 most-viewed documents
- Q&A submissions and response times
- New document uploads by your team
Share a simplified version with your advisory team so everyone understands where each bidder stands.
Pre-Decision Before final bids, pull a comparative engagement report across all bidders. This shows which parties did the deepest work and which areas they focused on. It often correlates with bid quality, since bidders who did thorough diligence tend to submit cleaner offers with fewer conditions.
Post-Close
A final audit trail export serves as your compliance record. Most regulatory and governance frameworks expect you to demonstrate who accessed what information and when. Export the full activity log and archive it alongside your deal documentation.
Common Analytics Mistakes to Avoid
Analytics can mislead you if you read them without context. Here are the traps experienced deal teams learn to avoid.
Confusing Volume With Intent
A high login count does not equal serious interest. Some organizations assign junior analysts to download and catalog every document systematically. That generates impressive-looking engagement numbers without indicating executive-level commitment. Weight your analysis toward the seniority and role of the users, not just their activity volume.
Ignoring the Baseline
Different deal types produce different engagement patterns. A strategic buyer evaluating an acquisition will review documents differently than a financial sponsor running a leveraged buyout. Private equity firms often have standardized diligence checklists that drive methodical, evenly distributed engagement. Strategic buyers tend to cluster their attention around synergy-relevant sections. Neither pattern is inherently better or worse.
Over-Reacting to Single Data Points
A buyer who has not logged in for three days is not necessarily losing interest. Their deal team might be processing what they have already reviewed, waiting for an internal meeting, or busy with other priorities. Look at trends over weeks, not individual days.
Neglecting Your Own Response Metrics
Analytics are a two-way mirror. Buyers notice when your Q&A responses are slow, when requested documents take days to upload, or when supplementary materials arrive incomplete. Track your own team's response times and upload cadence alongside buyer engagement. A well-run process invites deeper engagement.
How Modern Platforms Handle Data Room Analytics
The analytics landscape across VDR providers varies . Here is what to look for when evaluating platforms.
Traditional VDR Providers
Enterprise platforms like Datasite,
Intralinks, and Ansarada offer sophisticated analytics suites built for large M&A transactions. Ansarada's platform uses AI to predict deal outcomes based on bidder viewing patterns, claiming 97% accuracy in forecasting which deals will close. Datasite provides detailed engagement reports segmented by bidder group, with heatmaps showing document-level and folder-level activity.
These platforms typically charge premium pricing, often $15,000 or more per month for active deals, which reflects the high-stakes transactions they serve.
Mid-Market and Startup Alternatives
Platforms like Digify,
FirmRoom, and DealRoom have brought page-level analytics to smaller deals at lower price points. Some, like Peony, include page-level analytics on free tiers, making granular engagement data accessible to founders running seed or Series A fundraises.
Workspace Platforms With Analytics
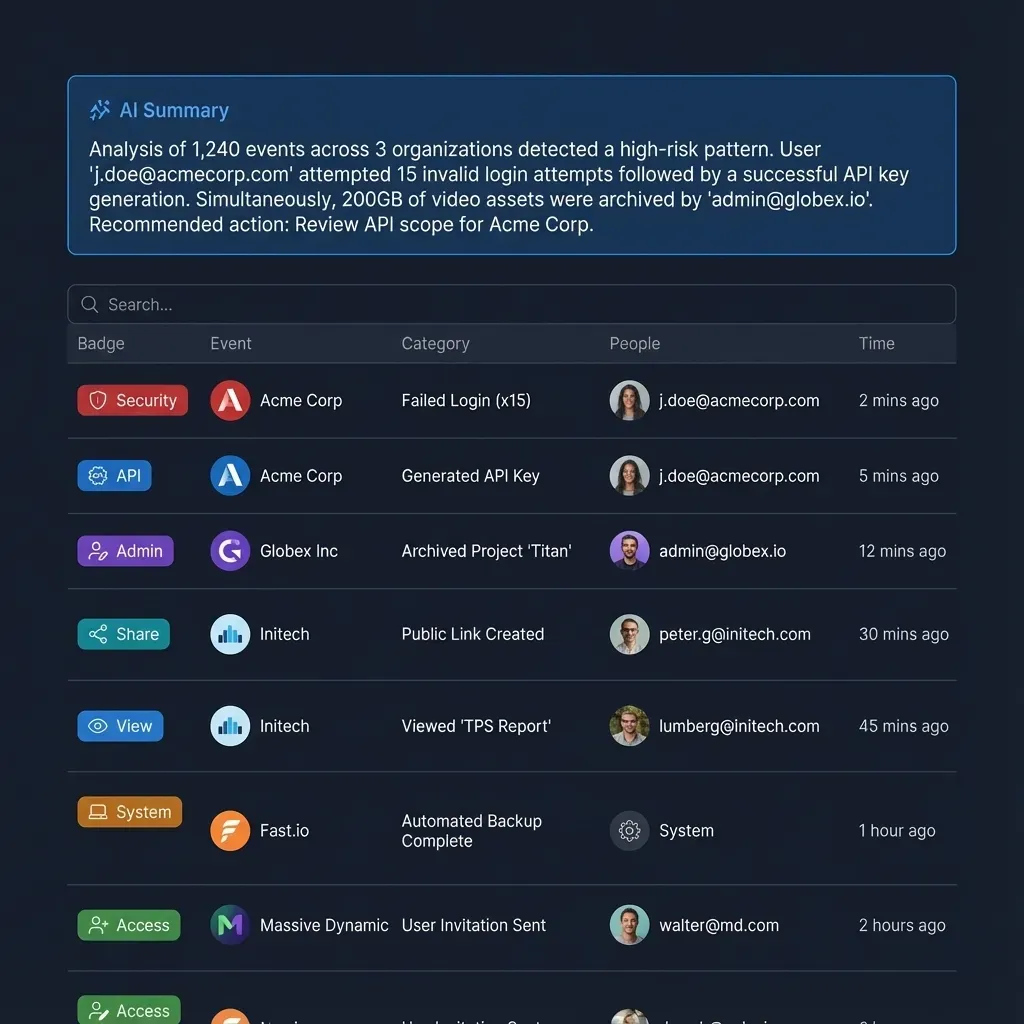
Cloud workspace platforms are adding analytics capabilities that overlap with traditional VDR features. Fastio, for example, provides portal analytics that track viewer engagement and document access patterns within branded content portals. Combined with audit trails that cover file operations, membership changes, and AI activity, teams get visibility into how recipients interact with shared materials.
Fastio's approach works well for teams that need data room functionality alongside broader workspace features. The audit trail covers every file operation, comment, and membership change with timestamps, and portals support branded, password-protected access with auto-expiring links. For teams running smaller deals or ongoing client relationships where a full enterprise VDR would be overkill, this kind of integrated analytics provides the engagement visibility you need without a separate platform.
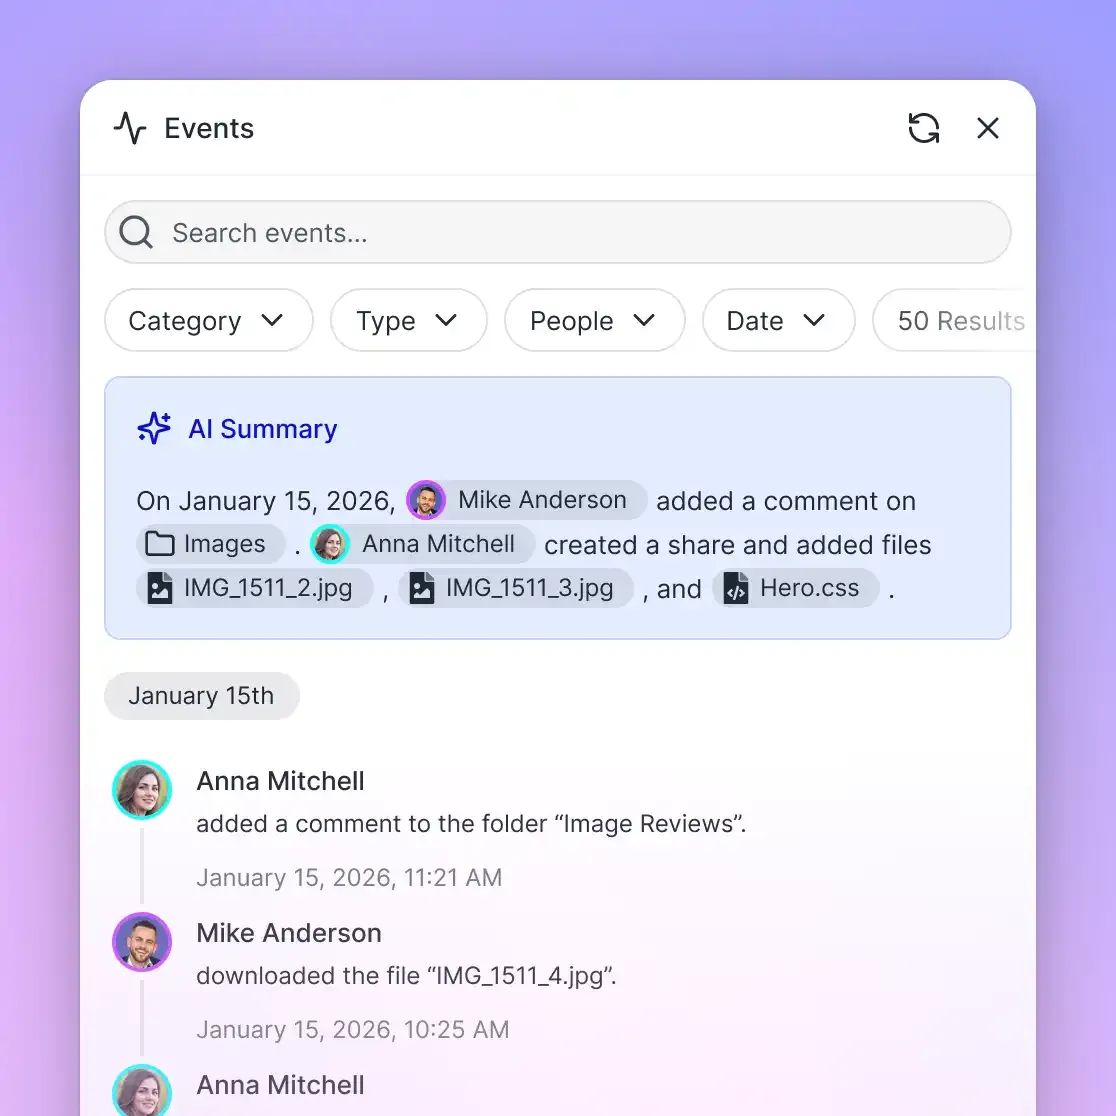
If your workflow involves AI-assisted document review, Fastio's Intelligence feature auto-indexes uploaded files for semantic search and citation-backed Q&A, so deal teams can ask questions across the entire room without reading every document manually.
Frequently Asked Questions
What analytics do data rooms provide?
Virtual data rooms track login activity, document views, page-level reading time, download history, print attempts, Q&A submissions, and user session duration. Advanced platforms add heatmaps showing which document sections receive the most attention, engagement scoring by user or group, and AI-powered predictions about deal outcomes based on viewing patterns.
How do you track activity in a virtual data room?
Activity tracking is built into the platform. Every action, including logins, file views, downloads, and Q&A interactions, is logged automatically with timestamps and user identification. Administrators can view this data through real-time dashboards, filter by user or document, and export activity reports as CSV files for external analysis or compliance records.
What reports can you generate from a data room?
Standard reports include user access summaries, document engagement reports, Q&A status tracking, comparative bidder analysis, and full audit trail exports. Most platforms let you schedule automated report delivery, filter by date range or user group, and export data in CSV or PDF format for board presentations and regulatory compliance.
Can data room analytics predict deal outcomes?
Some platforms use engagement patterns to forecast deal likelihood. The underlying logic is straightforward: bidders who review more documents, ask more questions, and sustain activity over time are more likely to submit competitive bids. AI-enhanced analytics can detect patterns like viewing sequence, reopen rates, and role-based engagement that correlate with deal closure.
How often should you review data room analytics during a deal?
Weekly reviews work well for most active processes. During critical phases, like the period between management presentations and final bids, daily check-ins help you catch engagement shifts early. The goal is to spot trends and respond proactively, not to monitor every individual login in real time.
Are data room analytics privacy requirements compliant?
Most reputable VDR providers build their analytics with privacy regulations in mind. Users are typically informed that their activity is tracked as part of the data room terms of access. However, specific compliance details vary by provider and jurisdiction. Check with your legal team and your VDR provider about data processing agreements, retention policies, and cross-border data transfer provisions.
Related Resources

Track Document Engagement Across Your Deal Room
Fastio portals give your team analytics on viewer activity, document access, and engagement patterns. Audit trails, branded portals, and AI-powered document search included. Start 14-day trial, no credit card required. Built for data room analytics and reporting workflows.