How to Build an AI Agent Performance Dashboard
Most teams running AI agents in production rely on raw logs to detect problems, which means failures go unnoticed for hours. An AI agent performance dashboard gives you a single screen showing task success rates, latency breakdowns, token costs, and error patterns in real time. This guide walks through the five metrics every dashboard needs, the tooling options for building one, and how to wire up file-operation tracking for agents that manage documents and deliverables.

What an AI Agent Performance Dashboard Actually Does
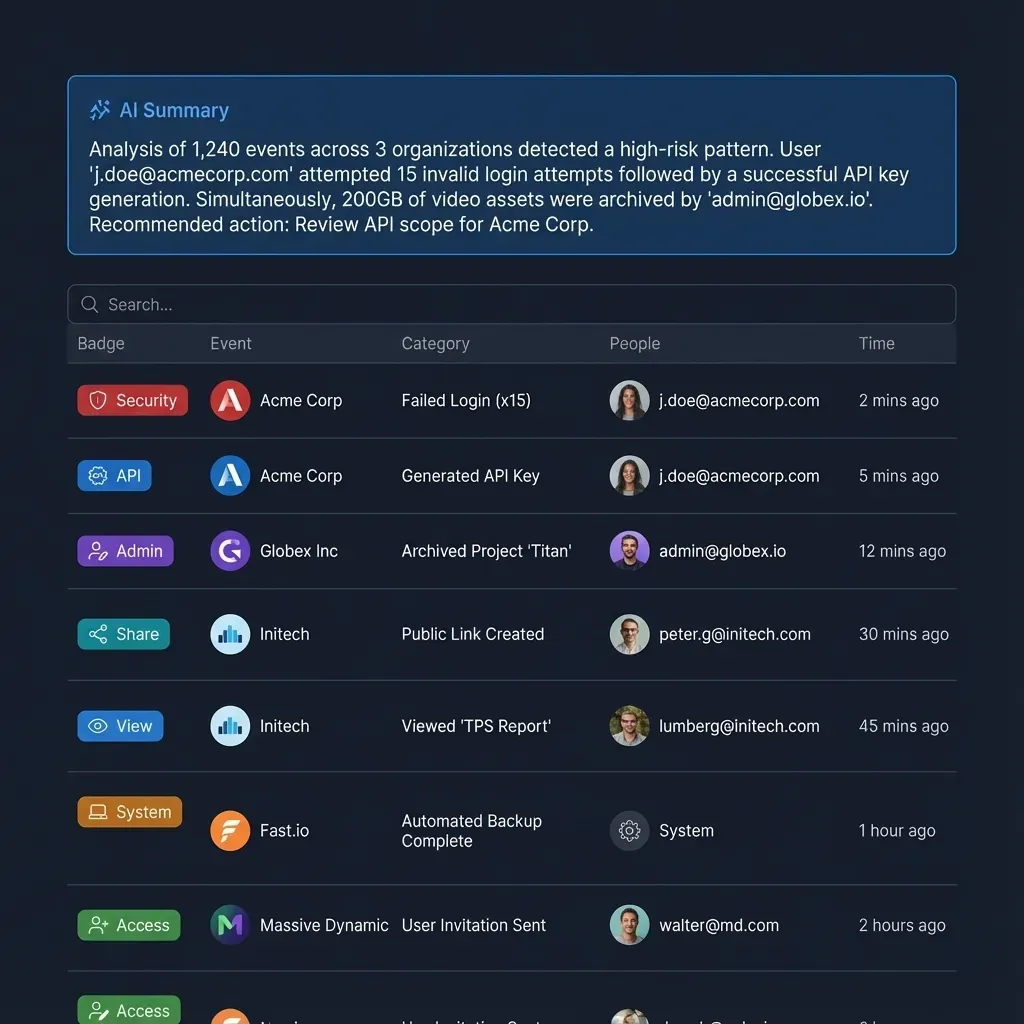
An AI agent performance dashboard is a visual monitoring interface that displays real-time and historical metrics about agent task completion, tool usage, costs, and error rates. It sits between raw telemetry data (logs, traces, spans) and the humans who need to act on that data.
The distinction from a general observability setup matters. Observability gives you the raw materials: structured logs, distributed traces, metric time series. A dashboard turns those materials into answers you can read at a glance. "Is my agent broken?" should take two seconds to answer, not twenty minutes of grepping through CloudWatch.
Traditional application dashboards track request throughput and HTTP error codes. Agent dashboards need different panels because agents make decisions, call tools in sequences, and accumulate costs per task. An agent can return HTTP 200 while confidently producing wrong output or burning through your token budget on retry loops.
Teams with dedicated agent dashboards detect failures roughly 70% faster than those relying on log-only monitoring, according to operational data from organizations adopting agent observability platforms. The speed difference comes from pattern recognition: a dashboard makes it obvious when task success rate drops from 92% to 74% over lunch. A log file buries that signal in thousands of lines.
What to check before scaling ai agent performance dashboard
Not every metric deserves a spot on your dashboard. Too many panels create noise. Too few hide problems. These five metrics cover the ground between "is it working?" and "is it worth the money?"
1. Task Success Rate
The percentage of tasks your agent completes end-to-end without human intervention. This is the single most important number on the dashboard. Production agents typically target 85-95% success rates depending on task complexity.
Track it as a rolling window (last 1 hour, 24 hours, 7 days) rather than a cumulative total. A cumulative number hides recent regressions. If your agent succeeded on 95% of tasks last month but dropped to 60% today, a cumulative view still shows a reassuring 93%.
Break success rate down by task type when possible. An agent that handles both file organization and document summarization might succeed at 98% on file tasks but only 70% on summarization. The blended number masks the problem.
2. Average Latency per Task
End-to-end time from task submission to completion. This includes model inference time, tool call execution, any waiting on external APIs, and file I/O.
Display both p50 (median) and p95 latency. The median tells you the typical experience. The p95 tells you how bad the worst cases get. If your p50 is 3 seconds but your p95 is 45 seconds, you have a tail latency problem that the average alone would hide.
Useful latency targets vary by use case. Simple classification or routing tasks should finish in under 1 second. Complex multi-step workflows with tool calls might take 2-4 seconds. Anything above 10 seconds for a single agent run warrants investigation.
3. Tool Call Error Rate
The percentage of tool invocations that fail, time out, or return unexpected results. Agents depend on tools (APIs, file systems, databases, MCP servers) to take action. When tools break, agents either fail silently or enter retry loops that waste tokens.
Group errors by tool name. If your file-upload tool fails 15% of the time but your search tool is at 0.1%, that tells you exactly where to focus debugging effort.
4. Token Cost per Task
Total token spend (input plus output) per completed task, converted to dollars. This is where agents surprise you. A poorly prompted agent might retry a task five times before succeeding, spending $2.00 on what should cost $0.15.
Track cost per successful task, not just cost per attempt. If an agent fails three times before succeeding on the fourth try, the real cost of that task is the sum of all four attempts. A dashboard that only shows per-attempt cost understates the true expense.
Set budget alerts at the task level. A single runaway agent loop can burn through hundreds of dollars in minutes if token costs go unchecked.
5. File Operations per Minute
For agents that manage documents, files, or deliverables, tracking file operation throughput gives you a proxy for productive work. This includes uploads, downloads, reads, writes, moves, and deletes.
A sudden drop in file operations often signals that an agent is stuck. A sudden spike might indicate a loop. Neither pattern is visible in token cost data alone, because an agent can spend tokens reasoning about what to do without actually doing anything.


Give Your Agents a Workspace Worth Monitoring
Fast.io provides persistent, intelligent workspaces with built-in audit trails and MCP access. Start with 50GB free storage, no credit card required, and wire your agent file operations into your dashboard from day one. Built for agent performance dashboard workflows.
Choosing Your Dashboard Stack
You have three broad options for building an agent performance dashboard: purpose-built agent observability platforms, general-purpose dashboards with custom instrumentation, or a hybrid approach.
Purpose-Built Agent Platforms
Tools like Langfuse, AgentOps, and LangSmith are designed specifically for LLM and agent monitoring. They understand concepts like traces, spans, tool calls, and token usage natively.
Langfuse is open-source and has become one of the most popular options, with over 6 million SDK installs per month. It handles prompt management alongside observability, so you can correlate prompt changes with performance shifts. Self-hosting is straightforward if you need data to stay on your infrastructure.
AgentOps focuses specifically on autonomous agent monitoring rather than general LLM observability. It provides session replay, hierarchical multi-agent tracking, and agent-specific anomaly detection out of the box.
LangSmith integrates tightly with the LangChain ecosystem. If your agents are built on LangChain or LangGraph, LangSmith gives you hierarchical tracing and visual debugging with minimal configuration. LangGraph Studio adds checkpoint-based state rewind for debugging stateful workflows.
General-Purpose Dashboards
Grafana, Datadog, and New
Relic can all serve as agent dashboards if you instrument your agents to emit the right metrics. The advantage is consolidation: your agent metrics live alongside your infrastructure metrics in a single pane.
The tradeoff is setup effort. You need to define custom metrics, build panels, and configure alerting rules yourself. There is no built-in concept of "agent trace" or "tool call span" in Grafana. You are building that abstraction from raw Prometheus counters or OpenTelemetry data.
Adopting OpenTelemetry as your instrumentation standard keeps your data portable across backends. Many agent frameworks already emit OpenTelemetry-compatible telemetry, so the integration cost is lower than building custom exporters.
Hybrid Approach
Run a purpose-built tool for deep agent debugging (traces, replays, prompt inspection) and feed summary metrics into your existing Grafana or Datadog instance for high-level monitoring and alerting. This gives your on-call engineers a familiar interface while your AI team gets specialized debugging tools.
Budget roughly 5-10% of your agent infrastructure cost for observability tooling and storage. At minimum, retain 30 days of full traces for anomaly detection baselines and trend analysis.
Setting Up Instrumentation
A dashboard is only as good as the data feeding it. Here is a practical approach to instrumenting your agents for dashboard-ready telemetry.
Treat Each Task as a Trace
Every user request or task assignment should create a single trace. Within that trace, create spans for each distinct phase: planning, model inference, tool calls, file operations, and response formatting. This structure lets your dashboard break down latency by phase and identify bottlenecks.
trace: "summarize-quarterly-report"
├── span: planning (120ms)
├── span: model-call (1,850ms, 3,200 tokens)
├── span: tool-call/file-read (340ms)
│   └── attribute: file_path = "/reports/q1-2026.pdf"
├── span: model-call (2,100ms, 4,100 tokens)
└── span: tool-call/file-write (180ms)
    └── attribute: file_path = "/summaries/q1-summary.md"
Tag Everything
Add attributes to every span: agent name, task type, model version, tool name, token count (input and output separately), and success/failure status. These attributes become the dimensions you filter and group by in your dashboard. Without them, you get aggregate numbers that are hard to act on.
Capture File Operation Metadata
For agents that work with files, log the operation type (read, write, upload, download), file size, file type, and the workspace or directory path. This data powers the "file operations per minute" panel and helps you correlate agent activity with storage costs.
If your agents use an MCP server for file operations, the server's response metadata already contains most of what you need. Fast.io's MCP server, for example, returns structured responses for each file operation that include timestamps, file identifiers, and operation status, which you can forward directly to your telemetry collector.
Emit Metrics, Not Just Traces
Traces are great for debugging individual failures. Metrics (counters, gauges, histograms) are what power dashboard panels. Emit a counter for every task completion (tagged with success/failure), a histogram for task duration, and a gauge for active concurrent tasks.
OpenTelemetry supports both traces and metrics in the same SDK, so you do not need separate libraries. Define your metrics once and let the exporter handle shipping them to whatever backend your dashboard reads from.
Wiring Up Alerts That Actually Help
A dashboard without alerts is a pretty picture nobody looks at. But poorly configured alerts create noise that teams learn to ignore. The goal is alerts that fire when something is genuinely wrong and stay quiet otherwise.
Start with Three Alerts
You do not need dozens of alert rules on day one. Start with three and expand as you learn your system's behavior:
Task success rate drops below threshold. Set this at 80% over a 15-minute rolling window. If your agents normally succeed at 90%+, a drop to 80% over 15 minutes means something changed. This catches model regressions, broken tools, and permission errors.
P95 latency exceeds baseline by 2x. Measure your normal p95 latency over a week, then alert when it doubles. This catches stuck agents, slow external APIs, and resource contention without firing on normal variance.
Token cost per task exceeds budget. Set a per-task cost ceiling (for example, $1.00 for a task that normally costs $0.20). This catches retry loops and runaway reasoning chains before they drain your API budget.
Avoid Alert Fatigue
Route alerts to the right channel. A task success rate drop goes to the engineering on-call. A cost spike goes to the team lead or budget owner. A latency increase during a known maintenance window gets suppressed.
Use alert grouping to prevent floods. If 50 tasks fail in the same minute because a downstream API is down, you want one alert that says "50 task failures, all tool-call/api-search errors," not 50 individual notifications.
Connect Alerts to Traces
Every alert should include a link to the relevant traces or dashboard panel. When an engineer gets paged at 2 AM for a success rate drop, they should be one click away from seeing which tasks failed and what tool calls went wrong. The gap between "something broke" and "here is the broken trace" is where incident response time lives.
Tracking Agent File Operations with Fast.io
Agents that produce deliverables (reports, processed documents, creative assets) need file operation tracking as part of their performance dashboard. Without it, you know an agent "succeeded" but not whether it actually produced and stored the intended output.
Why File Operations Matter for Dashboards
Token cost and latency tell you about the agent's reasoning process. File operation metrics tell you about its output. An agent can spend tokens thinking about a task, declare success, and never write a file. Your dashboard should catch that gap.
Tracking file operations also reveals workflow efficiency. An agent that reads the same file five times during a single task has a caching problem. An agent that writes intermediate files to a temporary directory and never cleans them up has a storage hygiene problem. These patterns are invisible without file-level telemetry.
Using Fast.io as the File Layer
Fast.io provides persistent, intelligent workspaces where agents store and manage their output. From a dashboard perspective, Fast.io gives you several monitoring advantages:
Audit trails built in. Every file operation in a Fast.io workspace is logged with timestamps, user/agent identity, and operation type. You can query this audit data to feed your dashboard's file operations panel without building custom logging.
MCP server with structured responses. Fast.io exposes its workspace operations through a Streamable HTTP MCP endpoint and legacy SSE. Each tool call returns structured metadata (file ID, version, size, timestamps) that maps directly to dashboard metrics.
Intelligence Mode for output validation. When Intelligence is enabled on a workspace, files are automatically indexed for semantic search and RAG queries. Your dashboard can include a quality-check step: after an agent writes a deliverable, query the workspace to verify the content matches the task requirements.
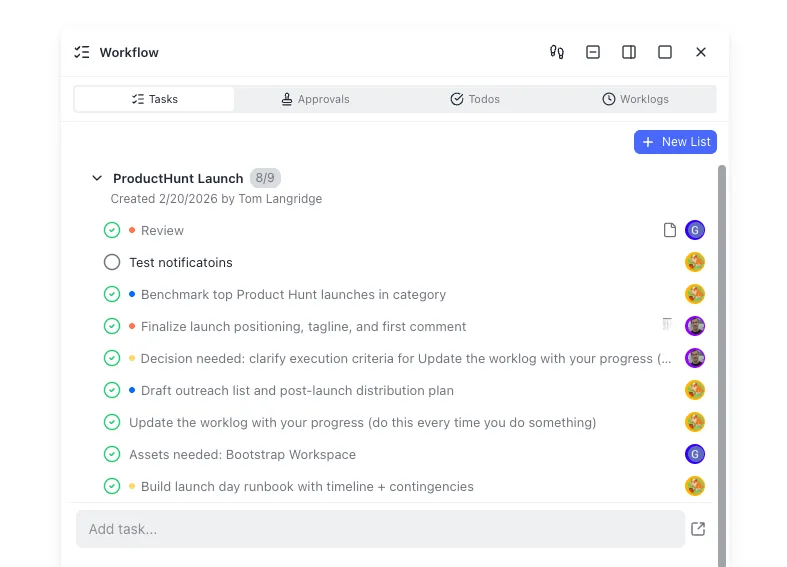
Ownership transfer for handoff tracking. Agents can build entire workspace structures and then transfer ownership to a human. Your dashboard can track this lifecycle: task assigned, agent working, deliverable stored, ownership transferred, human reviewed. This gives visibility into the full delivery pipeline, not just the agent's execution phase.
The free agent plan includes 50GB storage, 5,000 credits per month, and 5 workspaces with no credit card required. That is enough capacity to instrument a production agent pipeline and start collecting file operation data for your dashboard from day one.
Alternatives like Amazon S3 or Google Cloud Storage work for raw file persistence, but they require you to build audit logging, access control, and file intelligence as separate layers. Local file storage works for development but breaks when you need multiple agents or human reviewers to access the same outputs.
Frequently Asked Questions
How do I monitor AI agent performance?
Start by instrumenting your agents to emit traces and metrics for every task. Track five core metrics on a dashboard, which are task success rate, average latency, tool call error rate, token cost per task, and file operations per minute. Use OpenTelemetry for portable instrumentation and feed data into a purpose-built tool like Langfuse or AgentOps, or a general dashboard like Grafana. Set up alerts for success rate drops, latency spikes, and cost overruns.
What metrics should I track for AI agents?
The five essential metrics are task success rate (percentage of tasks completed without human intervention), average latency (end-to-end time per task, measured at p50 and p95), tool call error rate (grouped by tool name), token cost per successful task (not per attempt), and file operations per minute (for agents that produce deliverables). Break each metric down by task type and agent name so you can isolate problems quickly.
What is the best dashboard for AI agents?
It depends on your stack. Langfuse is the most popular open-source option with native agent tracing, prompt management, and self-hosting support. AgentOps is built specifically for autonomous agent monitoring with session replay and multi-agent tracking. LangSmith integrates deeply with LangChain. For teams already using Grafana or Datadog, a hybrid approach works well, where you use a specialized tool for deep debugging and feed summary metrics into your existing dashboards.
How much does agent observability cost?
Budget 5-10% of your agent infrastructure cost for observability tooling and data storage. Langfuse is free to self-host. Managed platforms like LangSmith and Datadog charge based on trace volume and data retention. Retain at least 30 days of full traces for anomaly detection baselines. The cost of not having observability, which includes undetected failures, runaway token spend, and slow incident response, typically exceeds the tooling cost within the first month of production.
Can I use Grafana for AI agent monitoring?
Yes, but you will need to build the agent-specific abstractions yourself. Grafana has no native concept of agent traces, tool call spans, or token usage. You will define custom Prometheus metrics or pipe OpenTelemetry data into Grafana and build panels for each metric. The advantage is consolidation with your existing infrastructure dashboards. The disadvantage is higher setup effort compared to purpose-built tools that understand agent workflows out of the box.
Related Resources

Give Your Agents a Workspace Worth Monitoring
Fast.io provides persistent, intelligent workspaces with built-in audit trails and MCP access. Start with 50GB free storage, no credit card required, and wire your agent file operations into your dashboard from day one. Built for agent performance dashboard workflows.