7 Best AI Agent Debugging Tools in 2026
AI agent debugging tools show you traces, states, and tool calls to make sure your agents work as intended. They help fix problems in single or multi-agent setups where errors usually come from tool calls or state mismatches. This comprehensive guide covers the top options, including a feature table, deep dives, and a look at why persistent file-based state is often the missing piece in debugging.

Why Debug AI Agents?
AI agents fail in production at an alarming rate. Research from Gartner and McKinsey indicates that up to multiple% of enterprise AI pilots fail to reach full production or deliver measurable ROI. Inconsistent performance is a major reason why teams hesitate to deploy them. Unlike traditional software where bugs are usually predictable, agent behavior changes based on LLM responses. This makes issues hard to reproduce. Traces show exactly where tool calls fail or where state drifts over time.
Multi-agent systems are even harder to manage. When agents work together, bugs often hide in the handoffs. One agent might send the wrong data to another, leading to failures that are tough to track down. A good debugger shows the full execution path and captures the communication between agents.
Most tools focus on what happens in memory, but agents also use files, documents, and persistent state. This is where many debuggers miss the mark. If you aren't inspecting the actual files and state an agent leaves behind, you might miss production issues until a user reports them.
Helpful references: Fastio Workspaces, Fastio Collaboration, and Fastio AI.
How We Evaluated
We rated these tools on tracing quality, evaluation support, how they handle multi-agent systems, state inspection, and cost. We gave extra points to open-source and self-hosted options for their flexibility.
Our scoring: traces (multiple%), UI and evals (multiple%), pricing (multiple%), multi-agent and state handling (multiple%), and integrations (multiple%).
We focused on tools that work well in production, particularly for users of LangChain, CrewAI, and AutoGen.


Debug Agents in Persistent Workspaces?
Fastio gives agents generous storage, audit logs, and file locks for reliable debugging. It works with any LLM through MCP. Built for agent debugging tools workflows.
Quick Comparison Table
1. LangSmith by LangChain
LangSmith traces LLM apps and agents from start to finish. It logs inputs, outputs, and every step in between, making it the deepest option for LangChain users. The platform plugs directly into your LangChain code, so you get traces without writing extra logging code.
Strengths:
- Full traces with LangGraph show exactly how data moves through multi-agent flows.
- Built-in evaluations let you set up custom metrics and track them as you iterate.
- Deploy agents directly from the platform to simplify your production workflow.
- Team-wide logging makes it easy to share traces with colleagues.
- Feedback scoring lets you mark runs as good or bad, which helps you build better datasets for fine-tuning later.
Limitations:
- It works best within the LangChain ecosystem. While it supports other frameworks, the setup is less automatic.
- You'll need a paid plan if you go over multiple traces a month.
Best for LangChain teams who need a complete view of how their agents are running. It's free for your first 5,000 monthly traces, then $39 per seat.
2. Arize Phoenix
Phoenix provides open-source tracing and evaluations for LLM apps. You can run it locally to keep your data private or use their cloud service if you want a faster setup. It’s popular in the open-source community because it gives you high-end observability without tying you to one provider.
Strengths:
- OpenTelemetry support means you can send your traces to any OTel-compatible backend.
- The prompt playground and clustering tools help you test prompt versions and see what works best.
- Multi-modal support lets you handle text, images, and other file types in your traces.
- You can deploy it offline to keep sensitive data inside your own network.
- Custom metrics let you define exactly how you want to measure success for your specific project.
Limitations:
- Hosted dashboards and advanced analytics require a Pro subscription at $multiple a month.
- Setting it up yourself takes more effort than using a managed service.
Best for teams that want full control over their data and tools. The core is free and open source; the Pro tier starts at $50 a month.
3. Langfuse
Langfuse brings traces, prompts, and evaluations together in one place. It’s built for teams that need to track prompt versions and actual usage as they move from testing to production. If you have strict data privacy rules, their self-hosting option is a strong choice.
Strengths:
- Agent graphs show you how your multi-agent systems talk to each other.
- Production dashboards show you cost, latency, and error rates in real time.
- It handles multi-modal data like text and images in the same trace.
- Prompt versioning keeps a history of your changes so you can roll back if needed.
- You can start on the free hobby tier or self-host for larger projects.
Limitations:
- Setting up the advanced evaluation tools takes some extra work.
- The dashboard has a lot of features, which can feel overwhelming at first.
Best for production setups where you need to keep your trace data on your own servers. There's a free hobby tier, and self-hosting gives you total control.
4. Helicone
Helicone is a proxy that sits between your app and your LLM provider. You just route your API calls through it, and you get logs without changing your code. It’s one of the simplest ways to add visibility to an existing project.
Strengths:
- Simple setup for OpenAI: swap your API endpoint and the logging starts.
- Cost tracking and alerts help you avoid surprise bills as your usage grows.
- Session grouping links related requests together, which is great for long conversations.
- Request caching can save you money by not paying for the same LLM response twice.
- Custom tags let you organize requests by user ID, session, or other metadata.
Limitations:
- It’s more of an API logger than a specialized agent debugger.
- Caching only works for identical requests, which doesn't happen often in complex agent tasks.
Best for teams that want to track costs and get basic logging without a heavy setup. It's free for up to 10,000 requests a month.
5. AgentOps
AgentOps is built specifically for agents and focuses on replaying exactly what happened. Since agent behavior can change every time you run it, being able to replay the exact sequence of events is important for fixing bugs.
Strengths:
- Time-travel debugging lets you step back through an agent's run to see why it made a certain choice.
- It works with LangChain, CrewAI, AutoGen, and most other major frameworks.
- The event viewer shows tool calls, LLM answers, and state changes in one timeline.
- It’s lightweight, so it doesn't slow down your agents while it's logging.
Limitations:
- It’s a newer tool, so the community and documentation are still growing.
- You might find fewer third-party integrations than you would with more established platforms.
Best for teams that need to replay complex agent runs to find out where things went wrong. Free for your first multiple events each month.
6. Logfire (OpenLLMetry)
OpenLLMetry sends traces to OTel backends like Logfire UI.
Strengths:
- Standard OTel.
- Broad integrations.
- Free OSS.
Limitations:
- Needs backend setup.
- No built-in evals.
Best for OTel users.
7. Fastio Workspaces
Fastio gives you persistent workspaces to inspect agent state through files and audit logs. While most tools focus on short-lived traces, Fastio lets you store your debugging data and work with humans in real time. It solves a common problem: the need to see the actual files an agent created and collaborate on the fix.
Strengths:
- File-based state: save traces, logs, or partial outputs as files and look at them in the dashboard.
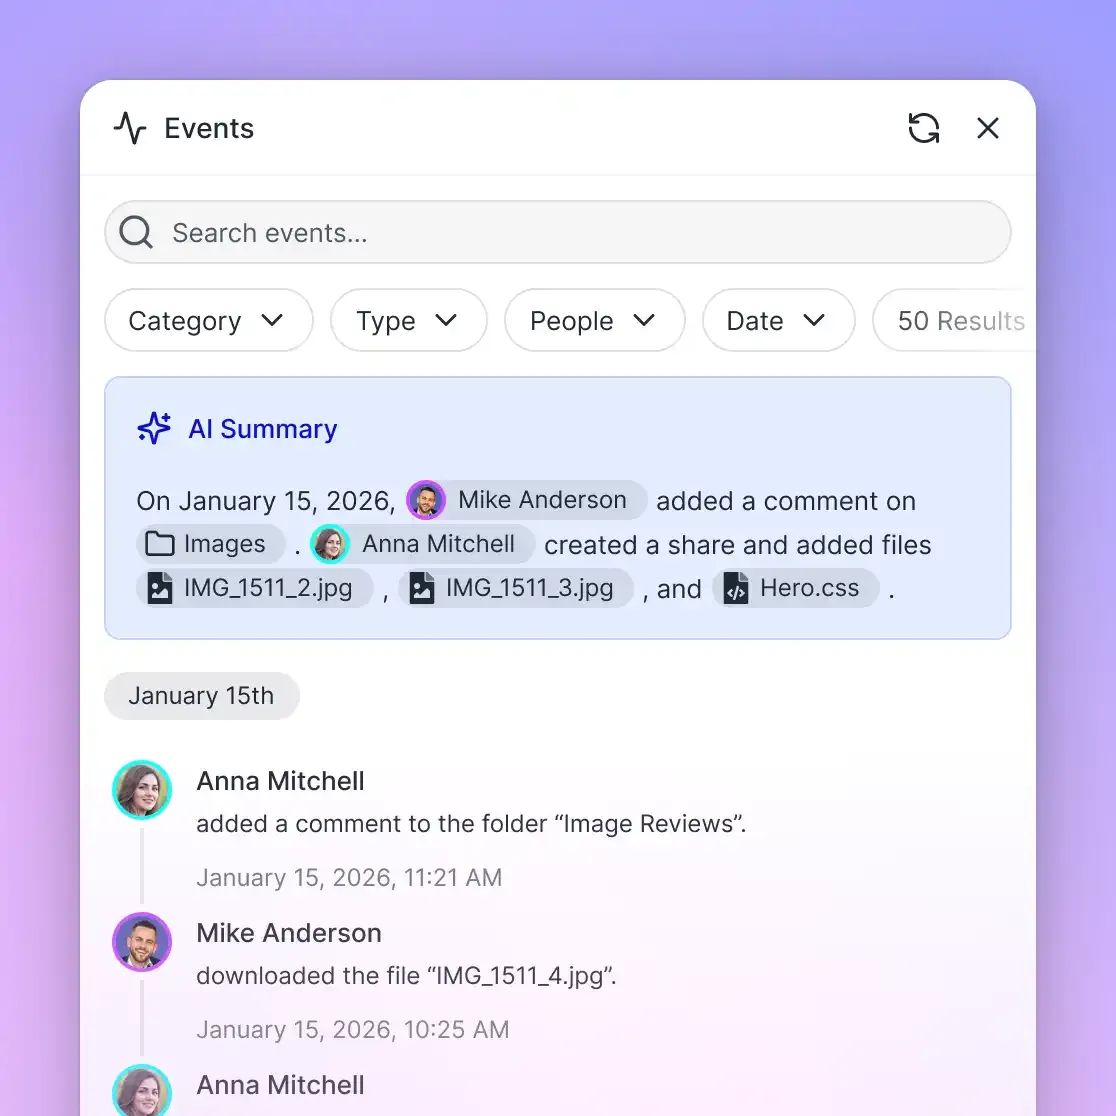
- Audit logs track every file action, uploads, edits, and downloads, so you have a full record of what happened.
- File locks stop agents from overwriting each other's logs or debugging data.
- Shared workspaces let people and agents work together on the same debugging session.
- Intelligence Mode lets you search through logs using natural language, so you can find errors by meaning instead of just matching keywords.
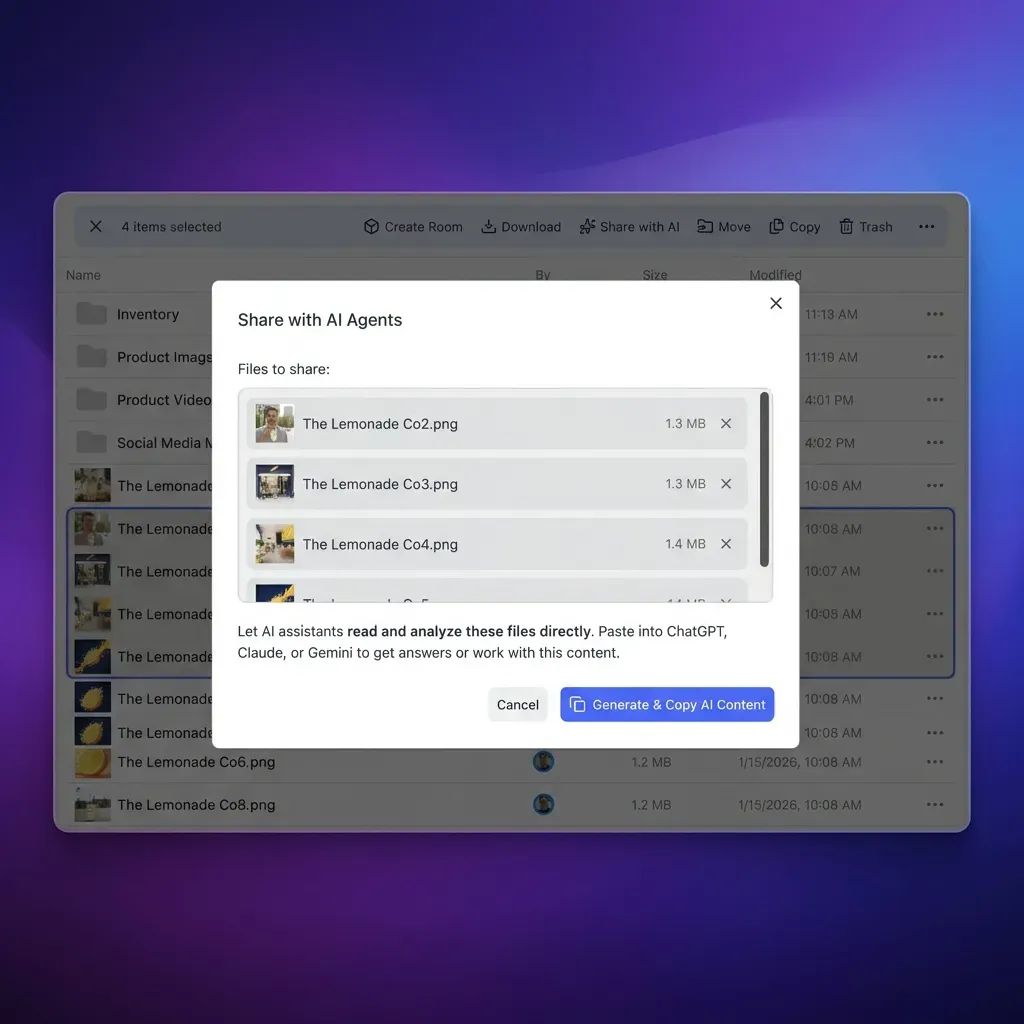
- Hundreds of MCP tools let you build automated debugging workflows that connect directly to your workspace.
- Business Trial: generous storage and monthly credits during the trial with no credit card needed.
Limitations:
- It’s a full workspace platform, not just a specialized tracing tool.
- You’ll use Intelligence Mode queries for evaluations instead of a traditional testing framework.
Best for teams with multiple agents that need a permanent place to store logs and collaborate. Agents use MCP tools to save their state, and humans can jump in to review it.
Which One to Choose?
The right tool depends on what you're building. If you want deep traces and high-end observability, go with LangSmith or Phoenix. For open-source control, Langfuse and Phoenix are your best bets. If you're watching your budget, Helicone and AgentOps have great free tiers. If you need to see the actual files your agents are using, Fastio fills a gap that most other tools miss.
Think about your setup: LangChain users will find LangSmith the easiest to use. If you need to host everything yourself to keep your data private, Phoenix and Langfuse are the top choices. For teams struggling with multi-agent coordination, AgentOps and LangGraph provide the clearest view of how agents interact.
Most debuggers aren't great at looking inside files. If your agents handle a lot of documents, try saving your traces to Fastio so your team can review them together. Combining a tracing tool with Fastio's file-based inspection gives you the clearest picture of what your agents are doing in production.
Frequently Asked Questions
How to debug AI agents?
Start by looking at traces to see the execution flow from beginning to end. Use evaluations to check if the output meets your requirements. For multi-agent systems, use tools that offer graph views to show how agents talk to each other. Tools like Phoenix or Langfuse are easy to set up because they plug into your code and map out the whole path for you.
Best open-source agent debugger?
Arize Phoenix and Langfuse are the top open-source choices. Phoenix is great for evaluations because of its playground and clustering tools. Langfuse is strong for managing production traces and offers a reliable self-hosting path. Both work with major frameworks and keep your data private on your own servers.
What are ai agent traces?
Traces record every step an agent takes: the prompt sent to the LLM, the tools it used, and the intermediate steps it took before giving a final answer. They create a history that helps you find loops, spot errors, and understand why an agent made a certain decision. They’re like a logbook for every move your agent makes.
Do these tools support multi-agent systems?
Yes, most modern debuggers support multi-agent setups. LangSmith uses LangGraph to map out agent conversations and data flows. AgentOps lets you replay sessions to see how agents interacted. Fastio uses file locks and audit logs so you can coordinate debugging for multiple agents working in the same shared workspace.
Is there free AI agent debugging?
Most major debugging tools have free plans. LangSmith gives you 5,000 free traces a month. Phoenix is open source and has a free tier. Helicone allows multiple requests, and AgentOps offers multiple events. Fastio’s agent plan is free forever and includes 50GB of storage for your agent logs and debugging files.
Related Resources

Debug Agents in Persistent Workspaces?
Fastio gives agents generous storage, audit logs, and file locks for reliable debugging. It works with any LLM through MCP. Built for agent debugging tools workflows.