Data Storage for Predictive Maintenance in Manufacturing
Predictive maintenance in manufacturing depends on reliable storage for vibration readings, temperature logs, and other sensor data. This guide covers the data types PdM systems generate, how to structure storage for fast retrieval and long-term analysis, and practical approaches to querying maintenance datasets at scale.

What Predictive Maintenance Data Actually Looks Like
Predictive maintenance programs generate a mix of structured time-series data and unstructured files. Understanding what you are storing is the first step toward building a system that scales.
Time-series sensor data is the backbone. Vibration sensors on rotating equipment produce RMS velocity and high-frequency acceleration readings, often sampled at 10 kHz or higher. Temperature sensors track bearing heat, motor winding temps, and ambient conditions. Current sensors monitor electrical draw for early signs of winding degradation. A single CNC machine might produce 50 to 100 MB of raw sensor data per day, and a mid-size plant with 200 monitored assets can generate 10 to 20 GB daily.
Maintenance records include work orders, inspection notes, parts replacement logs, and technician photos. These are typically PDFs, spreadsheets, and images stored alongside the sensor data they relate to.
Model artifacts round out the picture. Trained ML models, feature engineering scripts, and configuration files for anomaly detection thresholds all need versioning and access controls. When a data scientist updates a bearing failure model, the previous version should still be retrievable for comparison.
Contextual metadata ties everything together. Batch numbers, production line identifiers, operator shift logs, and environmental conditions (humidity, dust levels) provide the context that transforms raw sensor readings into actionable predictions. A chocolate factory profiled at IIoT World Days 2025 eliminated day-long plant shutdowns by correlating viscosity and temperature data with batch numbers, something only possible because the contextual metadata was stored alongside the sensor streams.
Helpful references: Fastio Workspaces, Fastio Collaboration, and Fastio AI.

What to check before scaling predictive maintenance manufacturing data storage
The storage architecture question for PdM is not "edge or cloud" but "what goes where and when." IDC estimates that 50% of enterprise data is now processed at the edge, driven by the need for sub-second response times in industrial environments. But edge nodes have limited capacity, and long-term trend analysis requires centralized storage.
Edge storage handles the immediate workload. Gateway devices at each machine or cell buffer the last 24 to 72 hours of high-frequency sensor data, run local anomaly detection, and send alerts when readings cross thresholds. This keeps latency under 100 ms for critical alerts and reduces bandwidth to central systems by 90% or more, since only summaries and flagged events travel upstream.
Cloud or on-premise centralized storage holds the full history. Time-series databases like InfluxDB or TimescaleDB handle the sensor streams. Object storage (S3, Azure Blob, or a workspace platform) holds the maintenance records, model artifacts, and contextual files. The key design decision is retention policy: raw high-frequency data might be downsampled after 90 days, while daily aggregates and event logs are kept for years.
Hybrid architectures are the practical default. Edge nodes handle real-time detection. Central storage handles training data, cross-plant comparisons, and compliance records. The gap between these two layers is where most PdM programs struggle, getting data from edge to center reliably, with the right metadata attached, without losing context.
One pattern that works well: edge devices write sensor summaries and anomaly flags to a central workspace in near-real-time, while raw high-frequency data syncs in batched uploads during off-peak hours. This gives analysts access to both the overview and the detail without overwhelming network bandwidth.
Organizing Files for Fast Retrieval
PdM storage is only useful if the right person (or the right model) can find the right data quickly. Most manufacturing teams underestimate this problem until they are three years into a program and drowning in files.
Folder hierarchies matter more than you think. A structure like plant > line > asset > data-type > date works for human navigation, but it breaks down when you need to query across assets. "Show me all bearing vibration anomalies across Plant 3 in Q4" requires either a database index or a search system that understands file contents.
Naming conventions prevent chaos. Standardize on a pattern like {asset-id}_{sensor-type}_{timestamp}.{format} for sensor exports. Use ISO 8601 timestamps so files sort chronologically. Document the convention in a README at the root of your storage, and enforce it in your ingestion pipeline.
Tagging and metadata extraction bridge the gap between file storage and database-style queries. When a vibration report PDF lands in storage, extracting the asset ID, measurement date, and anomaly classification into searchable metadata means analysts can find it without remembering where it was filed.
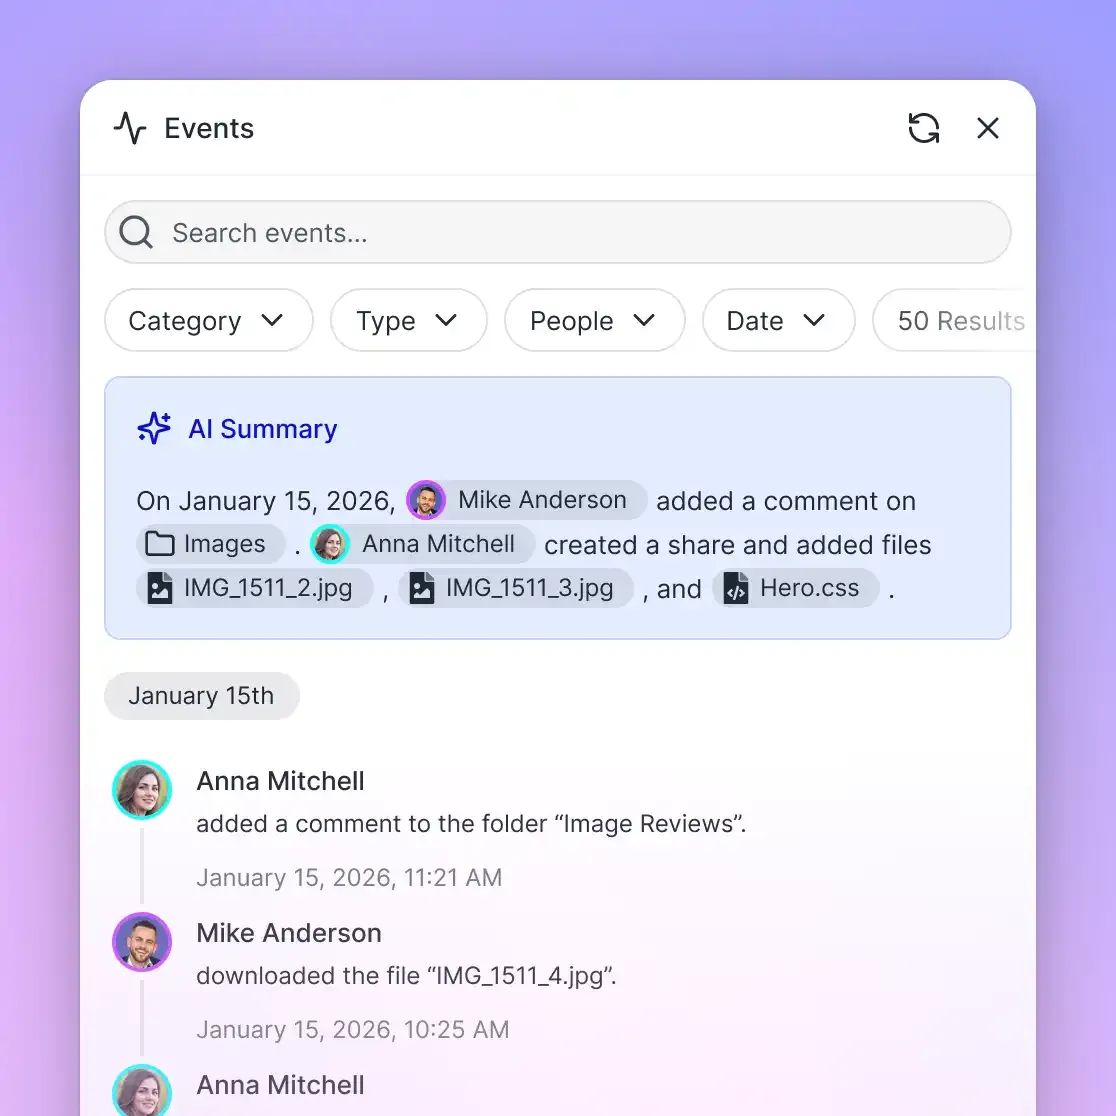
Platforms with built-in intelligence features take this further. Fastio's Intelligence Mode, for example, auto-indexes uploaded files for semantic search and RAG-style querying. Upload a set of maintenance reports to a workspace and you can ask questions like "which assets had repeated temperature warnings in February" and get answers with citations pointing to specific files and pages. This eliminates the manual tagging step that most teams skip anyway.
Format choices affect everything downstream. Parquet and ORC compress columnar sensor data by up to 80% compared to CSV, and they support predicate pushdown so queries only scan relevant columns. For high-resolution waveforms (vibration FFT data, acoustic emissions), HDF5 handles multi-dimensional arrays efficiently. Keep raw CSVs from edge devices as an archive, but convert to columnar formats for the analysis layer.


Centralize Your Maintenance Documents
Fastio workspaces organize maintenance reports, model artifacts, and inspection files with built-in search, permissions, and AI-powered querying. Start with generous storage, no credit card required. Built for predictive maintenance manufacturing data storage workflows.
Querying Maintenance Datasets with RAG
The most common complaint from maintenance engineers is not "we don't have enough data" but "we can't find what we need." Retrieval-augmented generation (RAG) addresses this directly by letting teams ask questions in natural language and get answers grounded in their actual maintenance records.
How RAG works for PdM. Documents, including inspection reports, failure analyses, vendor datasheets, and maintenance procedures, are indexed into a vector store. When an engineer asks "what was the root cause of the compressor failure on Line 7 last March," the system retrieves the most relevant documents, feeds them to an LLM, and returns an answer with citations. No SQL queries, no digging through folders.
What to index. Start with failure reports, root cause analyses, and maintenance procedures. These contain the institutional knowledge that usually lives in one senior technician's head. Add vendor equipment manuals and spare parts catalogs. Then layer in inspection photos and sensor anomaly summaries. The more maintenance context in the index, the better the answers.
Practical setup. You can build a RAG pipeline from scratch with a vector database, an embedding model, and an LLM. Or you can use a platform that bundles these together. Fastio's workspace intelligence auto-indexes files when you upload them. Enable Intelligence on a workspace, drop in your maintenance documents, and the system builds the index automatically. Engineers query through chat, and responses cite the specific files and pages that support each answer.
Where RAG falls short. RAG works best with text-heavy documents, not raw time-series data. For sensor queries ("show me vibration trends for Asset 412"), you still need a time-series database with proper visualization tools. RAG complements that by answering the "why" questions: why did this asset fail, what does the maintenance procedure say, has this happened before.
The combination of a time-series database for sensor data and a RAG-enabled workspace for maintenance documents covers the full spectrum of questions a PdM team needs to answer.
Data Quality and Governance
A 2025 review in ScienceDirect found that fragmented systems, inconsistent data formats, and poor storage practices are the top barriers to effective PdM. The models are only as good as the data feeding them.
Sensor data quality starts at the source. Poor sensor placement produces misleading readings. A vibration sensor mounted on a guard cover instead of the bearing housing picks up structural noise, not bearing condition. Temperature sensors too far from the heat source introduce lag. Before investing in storage and analytics, audit your sensor placement against manufacturer recommendations.
Data format standardization is non-negotiable. When Plant A exports vibration data as CSV with timestamps in local time and Plant B uses Parquet with UTC timestamps, cross-plant analysis becomes a data engineering project. Pick one format, one timestamp convention, and one unit system. Enforce it at the ingestion layer so bad data never reaches the central store.
Retention policies balance cost and utility. Raw high-frequency vibration data at 10 kHz generates roughly 3.5 GB per sensor per day. Keeping five years of raw data for 200 sensors requires over a petabyte. Most teams downsample to 1-second or 1-minute aggregates after 90 days and keep only anomaly windows at full resolution. Define these policies before you start, not after storage costs surprise you.
Access controls protect both data and models. Maintenance technicians need read access to reports and procedures. Data scientists need write access to model artifacts. Plant managers need dashboards but not raw data. Granular permissions at the workspace, folder, and file level prevent accidental overwrites and unauthorized access. Fastio supports permissions at the organization, workspace, folder, and file level, with audit trails that log every access event.
Version control for models and configurations. When a retrained model performs worse than its predecessor, you need to roll back. Store model files with clear version naming, and keep training data snapshots so you can reproduce results. File versioning in your storage platform handles this automatically if the platform supports it.
Building a PdM Storage Stack
Here is a practical reference architecture that scales from a single plant to a multi-site operation.
Layer 1: Edge ingestion. Gateway devices at each machine collect sensor data and buffer it locally. Use MQTT or OPC-UA for sensor-to-gateway communication. Run lightweight anomaly detection at the edge (threshold alerts, rolling average deviation). Forward summaries and alerts to the central layer in real time; batch-sync raw data on a schedule.
Layer 2: Time-series database. InfluxDB, TimescaleDB, or AWS Timestream for high-frequency sensor data. This is your query layer for "show me the vibration trend for this asset over the last 30 days." Retention policies here handle the downsampling: keep raw data for 90 days, 1-minute aggregates for 2 years, daily aggregates indefinitely.
Layer 3: File and document storage. This holds everything that is not a time-series data point: maintenance reports, failure analyses, model artifacts, equipment manuals, inspection photos, configuration files. Use a workspace platform with search and access controls rather than a bare object store. The ability to search file contents, tag assets, and set granular permissions pays for itself within months.
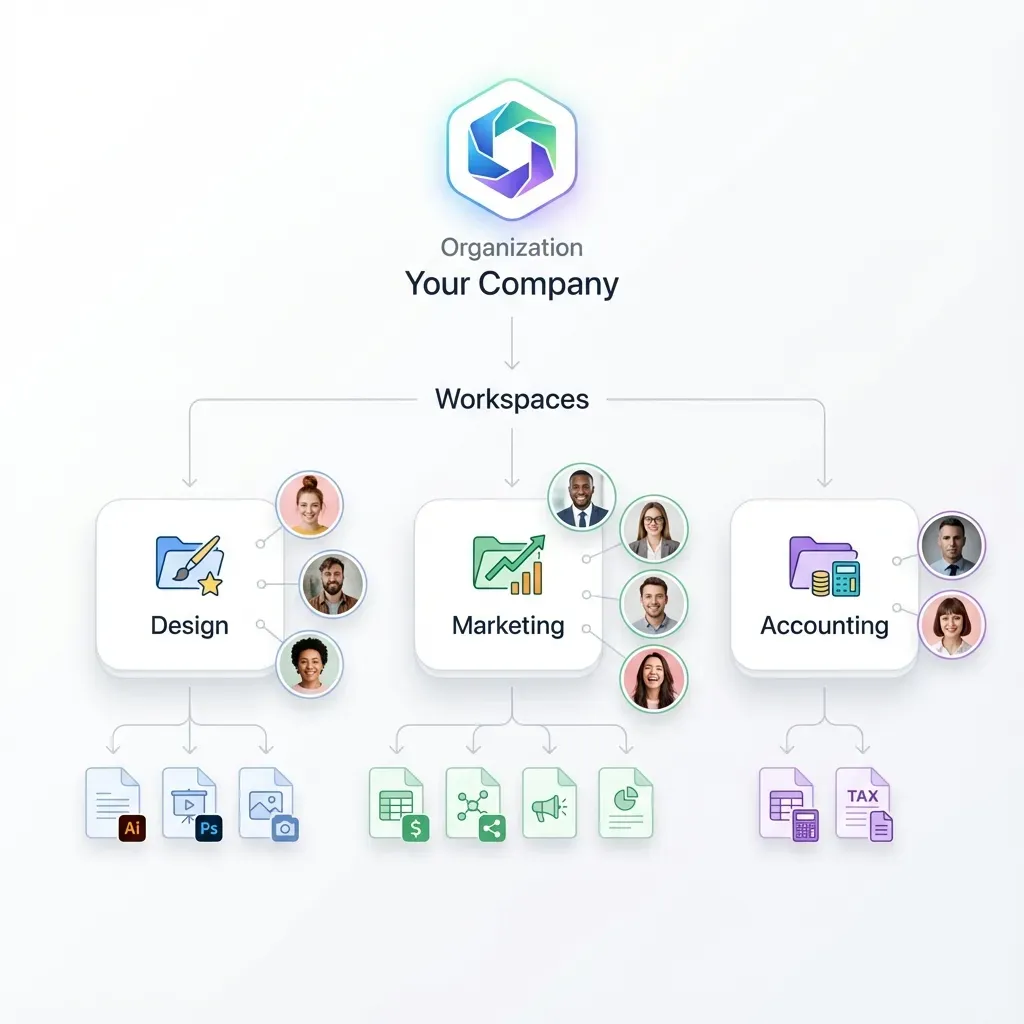
Fastio fits naturally at Layer 3. Workspaces organize files by plant, line, or asset. Intelligence Mode indexes documents for semantic search and RAG chat, so engineers can query maintenance history without writing database queries. Granular permissions keep data scientists, technicians, and managers in their lanes. Audit trails satisfy internal governance requirements. The Business Trial (50 GB storage, included credits, 5 workspaces) is enough to pilot the document layer for a single plant before committing to a paid tier.
Layer 4: Analytics and visualization. Grafana or similar dashboards for sensor trend visualization. Jupyter notebooks or MLflow for model development. These tools read from Layers 2 and 3. The key integration point is that your analytics layer can access both the time-series database and the document store, so a data scientist can pull sensor data and the corresponding maintenance records into the same analysis.
What this stack costs. For a mid-size plant with 200 monitored assets, expect $500 to published pricing for the time-series database (depending on retention and query volume), $50 to published pricing for document storage, and $200 to published pricing for dashboards and analytics tools. The biggest hidden cost is data engineering time to keep the pipeline running, so choose managed services where possible.
Frequently Asked Questions
What is the best storage for predictive maintenance data in manufacturing?
A hybrid approach works best. Use a time-series database (InfluxDB, TimescaleDB) for sensor data and a workspace platform with search and access controls for maintenance documents, model artifacts, and reports. Edge storage handles real-time buffering, while centralized storage supports long-term analysis and cross-plant comparisons.
How much data does a predictive maintenance program generate?
A single monitored asset can produce 50 to 100 MB of sensor data per day. A mid-size plant with 200 monitored assets generates 10 to 20 GB daily. Over a year, that is 3.5 to 7 TB of raw sensor data alone, plus maintenance records, model artifacts, and inspection photos.
What are the main PdM data storage challenges in manufacturing?
The top challenges are data fragmentation across siloed systems, inconsistent formats between plants, poor sensor placement producing unreliable data, high storage costs for raw high-frequency data, and difficulty finding relevant records when troubleshooting failures. A centralized storage platform with search and metadata extraction addresses the retrieval problem.
Can RAG be used for querying maintenance datasets?
Yes. RAG indexes maintenance documents (failure reports, procedures, vendor manuals) and lets engineers ask questions in natural language. It works well for text-heavy documents but is not a replacement for time-series databases when querying raw sensor trends. The two approaches complement each other.
How long should predictive maintenance data be retained?
Common practice is to keep raw high-frequency sensor data for 90 days, then downsample to 1-minute or daily aggregates for 2 to 5 years. Anomaly windows should be preserved at full resolution indefinitely. Maintenance reports, failure analyses, and model artifacts should be retained for at least 5 years for trend analysis and compliance.
Related Resources

Centralize Your Maintenance Documents
Fastio workspaces organize maintenance reports, model artifacts, and inspection files with built-in search, permissions, and AI-powered querying. Start with generous storage, no credit card required. Built for predictive maintenance manufacturing data storage workflows.