How to Build a LangSmith MCP Adapter for Agent Observability
Blind spots in agent execution are dangerous. When your AI agent calls an external tool via the Model Context Protocol (MCP), that interaction often disappears into a black box. A LangSmith MCP adapter solves this by proxying tool calls for full observability. This guide shows you how to integrate LangSmith with MCP to trace, debug, and optimize every tool execution in your agent's workflow.
What is a LangSmith MCP Adapter?
A LangSmith MCP adapter is a software bridge that intercepts, logs, and traces Model Context Protocol (MCP) tool calls within the LangSmith observability platform. Without this adapter, an AI agent's interaction with an MCP server, like a database, file system, or API, looks like a single, opaque step in the execution chain. The adapter wraps the standard MCP client, ensuring that every request sent to the server and every response received is recorded as a discrete "run" in LangSmith. This transforms a black-box agent into a transparent workflow where you can see exactly what data was sent to a tool, how long the tool took to execute, and what result (or error) was returned. For developers using LangChain, this functionality is often provided by the langchain-mcp-adapters package, which automatically converts MCP tools into LangChain-compatible tools that inherit native tracing capabilities.
Helpful references: Fastio Workspaces, Fastio Collaboration, and Fastio AI.
Why You Need Observability for MCP Servers
As agents move from chat interfaces to performing real work, the risk of failure increases. MCP servers connect agents to the real world, writing files, sending emails, or querying databases. You cannot afford to lose sight of these actions.
Debugging Latency: If your agent takes multiple seconds to respond, is it the LLM "thinking" or the MCP server hanging? Tracing reveals the bottleneck immediately.
Error Diagnosis: When a tool fails, an LLM might hallucinate a success message or retry endlessly. Observability captures the exact stderr output from the MCP server, allowing you to fix the underlying issue in the tool implementation.
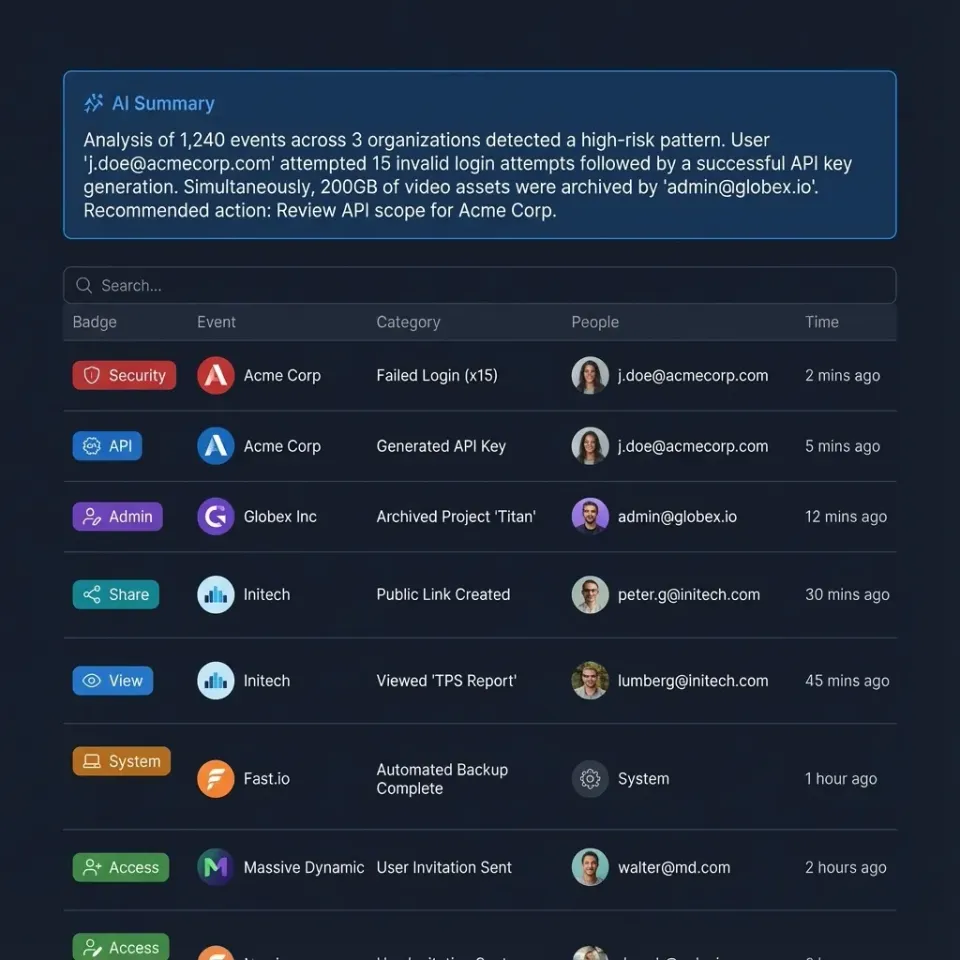
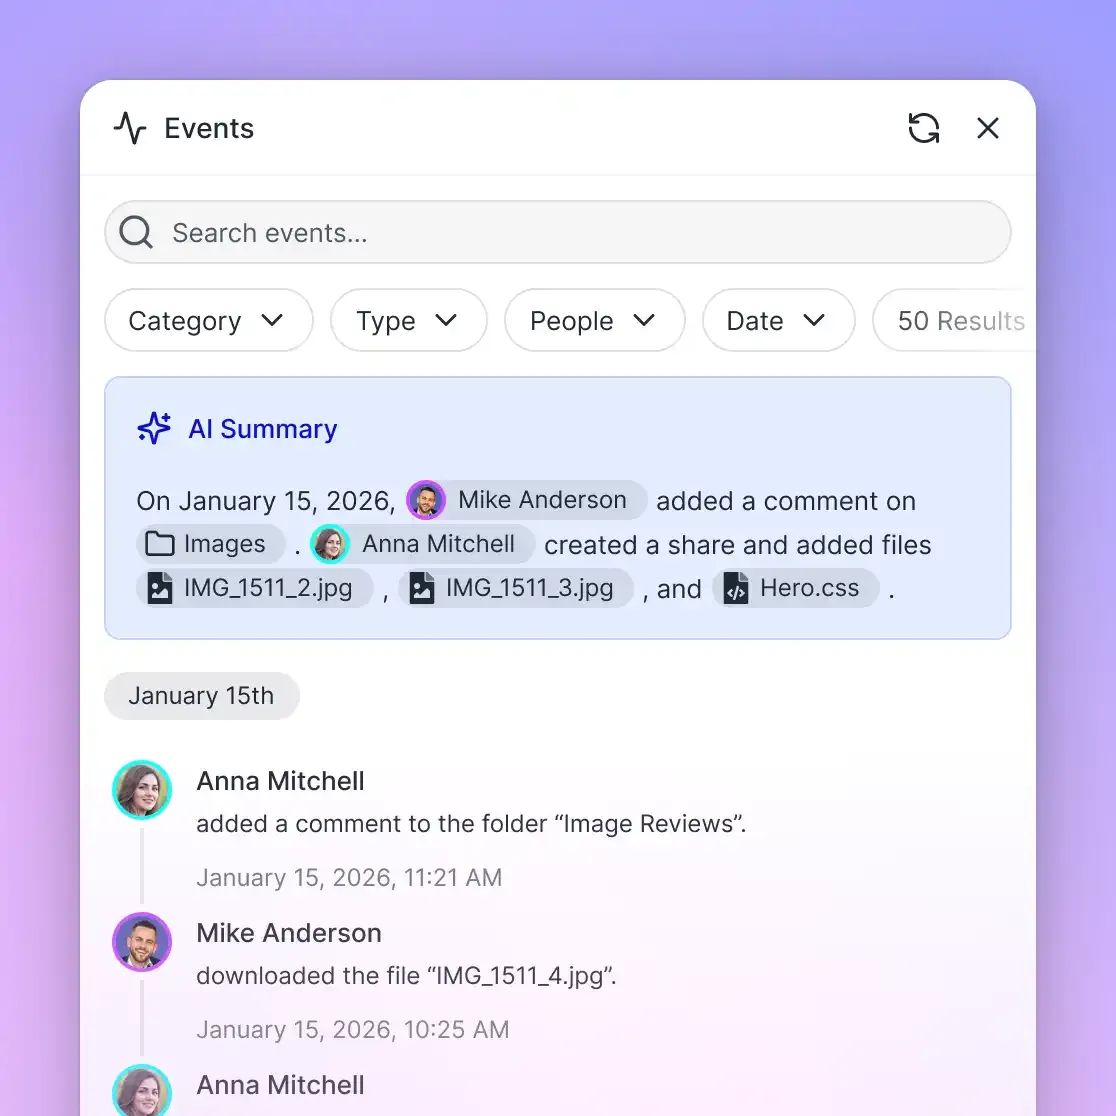
Audit Trails: For compliance, you often need to prove what an agent did. A LangSmith trace provides an immutable log of every file accessed and every command executed, which is critical for security-sensitive applications.


Give Your Agents a Traceable Workspace
Connect your agents to Fastio's managed MCP server. Get 19 consolidated tools, generous storage, and full visibility into every file operation. Built for langsmith mcp adapter workflows.
How to Build the Adapter (Step-by-Step)
Integrating LangSmith with an MCP server is straightforward when using the official adapter libraries. We will use Python for this example, assuming you have a basic LangChain agent set up.
Step 1: Install Required Packages
You will need the MCP SDK, LangSmith, and the adapter library.
pip install langchain-mcp-adapters langsmith langchain-openai
Step 2: Initialize the MCP Client
Instead of connecting to the MCP server directly, we wrap the connection in a MultiServerMCPClient. This client manages the connection lifecycle and exposes the server's capabilities as traceable tools.
from langchain_mcp_adapters.client import MultiServerMCPClient
from langchain_openai import ChatOpenAI
from langsmith import trace

### Define the connection to your MCP server
### This could be a local script or a remote URL (e.g., Fastio's server)
mcp_config = {
    "filesystem": {
        "transport": "stdio",
        "command": "npx",
        "args": ["-y", "@modelcontextprotocol/server-filesystem", "/users/me/docs"]
    }
}

async def run_agent():
    ### Connect to the MCP server
    async with MultiServerMCPClient(mcp_config) as client:
        ### Convert MCP tools to LangChain tools
        ### This is where the "Adapter" magic happens
        tools = await client.get_tools()

        ### Initialize the LLM with the wrapped tools
        llm = ChatOpenAI(model="gpt-4", temperature=0)
        llm_with_tools = llm.bind_tools(tools)

        ### Execute a traceable run
        response = await llm_with_tools.ainvoke(
            "List the files in the current directory"
        )
        print(response)
Step 3: View the Trace
Once the script runs, log in to your LangSmith dashboard. You will see a trace where the "List files" action is broken down. You can click into the specific tool call to see the raw JSON-RPC message sent to the MCP server and the JSON response received.
Analyzing Traces in LangSmith
Once your adapter is running, the LangSmith dashboard becomes your control center. A typical trace for an MCP interaction involves three key components:
- The LLM Generation: This shows the model deciding which tool to call. If the model picks the wrong tool or hallucinates arguments, you'll see it here.
- The Tool Call: This is the segment created by the adapter. It captures the latency of the network request (or IPC call) to the MCP server.
- The Tool Output: This displays the raw data returned by the server. If a file read returns multiple of text, you'll see why your context window overflowed.
According to LangChain, the platform handles over 40 million traces monthly, allowing developers to debug complex agent behaviors at scale. Using this data, you can refine your prompts to use tools more effectively or optimize your MCP server for better performance.
Fastio: The Ultimate MCP Observability Sandbox
Building your own MCP servers is powerful, but maintaining them is work. Fastio provides a managed MCP server with multiple pre-built tools for file operations, media processing, and search.
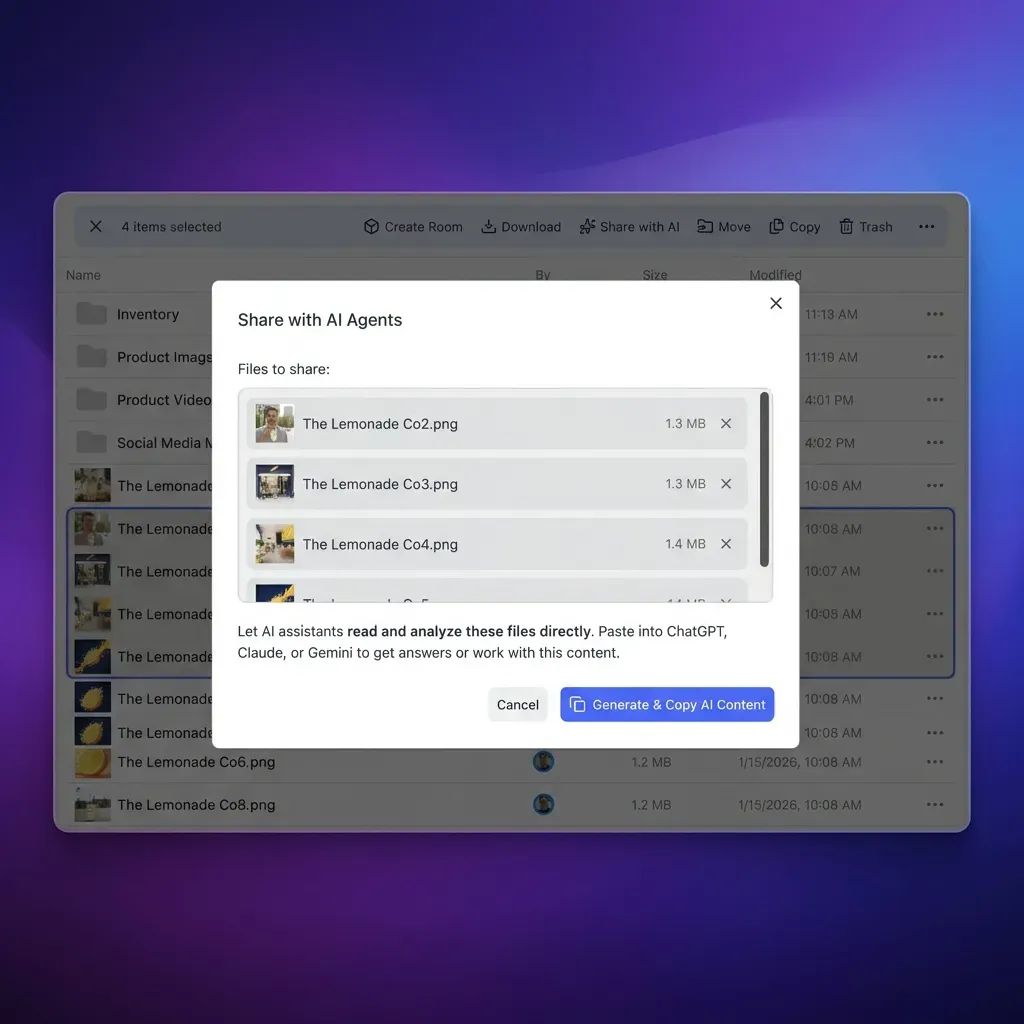
When you connect a LangSmith-traced agent to Fastio, you gain immediate observability into your agent's storage layer. You can track every time your agent reads a PDF, searches for a video, or creates a shared link.
Intelligence Mode Tracing: Because Fastio automatically indexes files, your agent can perform semantic searches (e.g., "Find the contract with the highest value"). In LangSmith, this appears not just as a "search" call, but you can inspect the exact vector query and the relevance scores of the returned documents. This allows you to debug why your agent retrieved specific files, closing the loop on retrieval-augmented generation (RAG) debugging.
Frequently Asked Questions
Can I trace MCP tools without LangChain?
Yes, but you need to manually wrap your MCP client. You would use the LangSmith SDK's `@traceable` decorator to wrap the function that sends the JSON-RPC request to the MCP server. This gives you the same visibility but requires more custom code than using the pre-built adapter.
How do I debug connection errors to the MCP server?
Connection errors usually appear in the trace as a failed run with a red status bar. Click on the error step to see the stack trace. Common issues include incorrect paths to the MCP server executable (for stdio transport) or network timeouts (for SSE transport).
Does this work with local MCP servers?
. The adapter works with both local `stdio` servers (running as subprocesses) and remote `sse` (Server-Sent Events) servers. LangSmith doesn't care where the server lives; it just traces the request and response.
Related Resources

Give Your Agents a Traceable Workspace
Connect your agents to Fastio's managed MCP server. Get 19 consolidated tools, generous storage, and full visibility into every file operation. Built for langsmith mcp adapter workflows.