How to Master AI Agent Observability: Logs, Traces & Metrics
Autonomous agents are black boxes that can burn credits and fail silently. AI agent observability turns these opaque systems into transparent workflows. This guide covers the essential pillars of monitoring agents, from tracing multi-step tool calls to auditing file operations, so you can debug faster and optimize performance.

What is AI Agent Observability?
AI agent observability is the practice of collecting, storing, and analyzing logs, traces, and metrics from autonomous AI agents to understand their behavior, diagnose failures, and improve performance. Unlike traditional software monitoring, which focuses on server health and latency, agent observability focuses on the reasoning process and action sequences of the AI.
When an agent fails, it rarely crashes with a stack trace. Instead, it might enter an infinite loop of tool calls, hallucinate a file path, or spend $20 attempting to solve a simple query [^6]. Observability gives you the X-ray vision needed to see these logic errors as they happen.
Effective observability answers three critical questions:
- What did the agent try to do? (Intent)
- Why did it make that decision? (Reasoning/Chain of Thought)
- What was the outcome? (Tool Output/File Change)
Why Agents Need Different Monitoring than LLMs
Monitoring a simple LLM chatbot is straightforward: you track inputs, outputs, and token counts. Autonomous agents, however, introduce a layer of complexity that requires a fundamentally different approach.
Agents operate in loops. They think, call a tool, observe the output, and think again. A single user request can trigger a chain of 50+ steps [^1]. Standard LLM monitoring tools will show you dozens of separate API calls, but they won't show you the thread connecting them.
Key Differences:
- Statefulness: Agents maintain memory across steps. You need to track how the context window evolves.
- Tool Side Effects: Agents modify the real world (writing files, sending emails). You must monitor these side effects, not just the text generation.
- Non-Determinism: The same prompt can lead to different tool paths. Tracing visualizes these diverging paths.
The Cost of Invisibility
Without observability, agent failures are expensive. Complex AI agents can experience high failure rates in office administration tasks. In a production environment, that kind of failure rate without logs means you are paying for compute that produces no value, with no way to diagnose the root cause.
The Three Pillars: Logs, Traces, and Metrics
To fully observe an agent, you need to capture data at three levels of granularity.
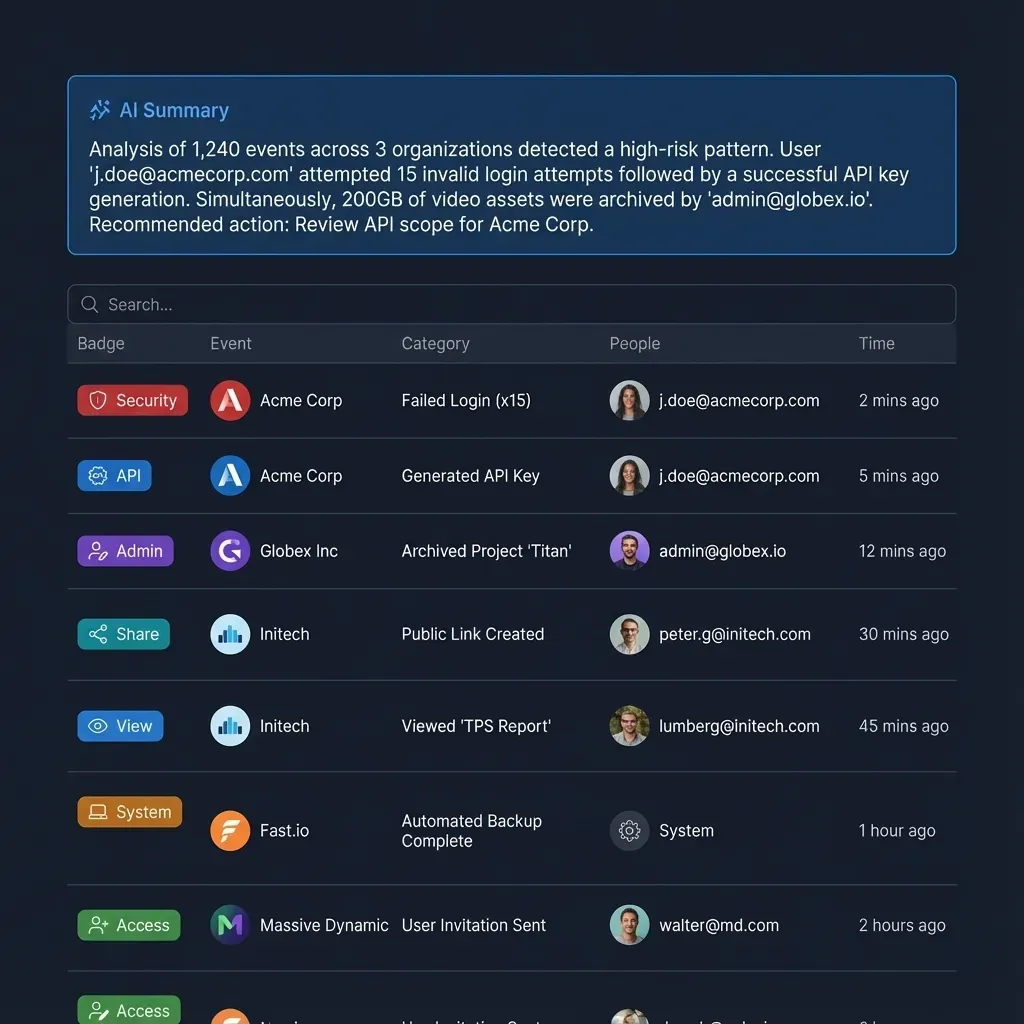
1. Event Logs (What happened) Logs capture discrete events with timestamps. For agents, this includes:
- Agent start/stop events
- Tool execution results (success/failure)
- File system modifications (create, update, delete)
- Error messages from external APIs
2. Traces (The Journey) Traces visualize the causal chain of events. A trace connects the initial user prompt to every subsequent thought and action. Tools like LangSmith or Arize Phoenix specialize in visualizing these "chains," allowing you to step through the agent's logic flow to find exactly where it went off the rails. For a complete overview of observability tools, see our guide to the best AI agent observability tools.
3. Metrics (The Health) Metrics are aggregated numerical data points used for alerting and trends.
- Task Completion Rate (TCR): The percentage of goals successfully achieved [^3].
- Steps per Task: A rising average step count might indicate the agent is getting confused or "looping" [^4].
- Cost per Task: The total token cost + tool usage cost for a completed workflow [^5].
How to Catch Common Agent Failures
Observability is your defense against the chaotic nature of non-deterministic models. Here are the most common failures and how to detect them.
The Infinite Loop
- Symptom: The agent calls the same tool repeatedly with slightly different arguments, or repeatedly lists a directory without taking action.
- Detection: Set an alert for "Steps per Task > X". If an agent exceeds 20 steps for a simple query, kill the process [^2].
The Hallucinated File Path
- Symptom: The agent tries to read a file that doesn't exist or writes to a directory it "thinks" is there.
- Detection: Monitor "File Not Found" errors in your tool output logs. High rates indicate the agent's mental model of the file system is out of sync with reality.
The Context Overflow
- Symptom: Performance degrades as the task progresses because the context window is full of previous tool outputs.
- Detection: Track "Token Usage" per step. When it approaches the model's limit, the agent will likely start forgetting instructions.
Fast.io: Workspace Observability for Agents
While tools like LangSmith handle the cognitive tracing of your agent, Fast.io provides observability for the environment your agent works in. Fast.io serves as the file system and collaboration layer for agents, giving you a distinct set of logs focused on artifacts and state. Learn more about Fast.io workspaces for AI agents or explore how to build AI agents with MCP.
File System Audit Trails Every time an agent (or human) reads, writes, or deletes a file, Fast.io logs the event. This creates an immutable record of what your agent produced. If an agent overwrites a critical report, the version history allows you to roll back immediately.
Reactive Webhooks
Fast.io webhooks allow you to build "observer agents." You can subscribe to file events and trigger a secondary agent to validate the output. For example, if your primary agent writes a contract.pdf, a webbook can trigger a generic "Reviewer Agent" to check the file for errors before notifying the human.
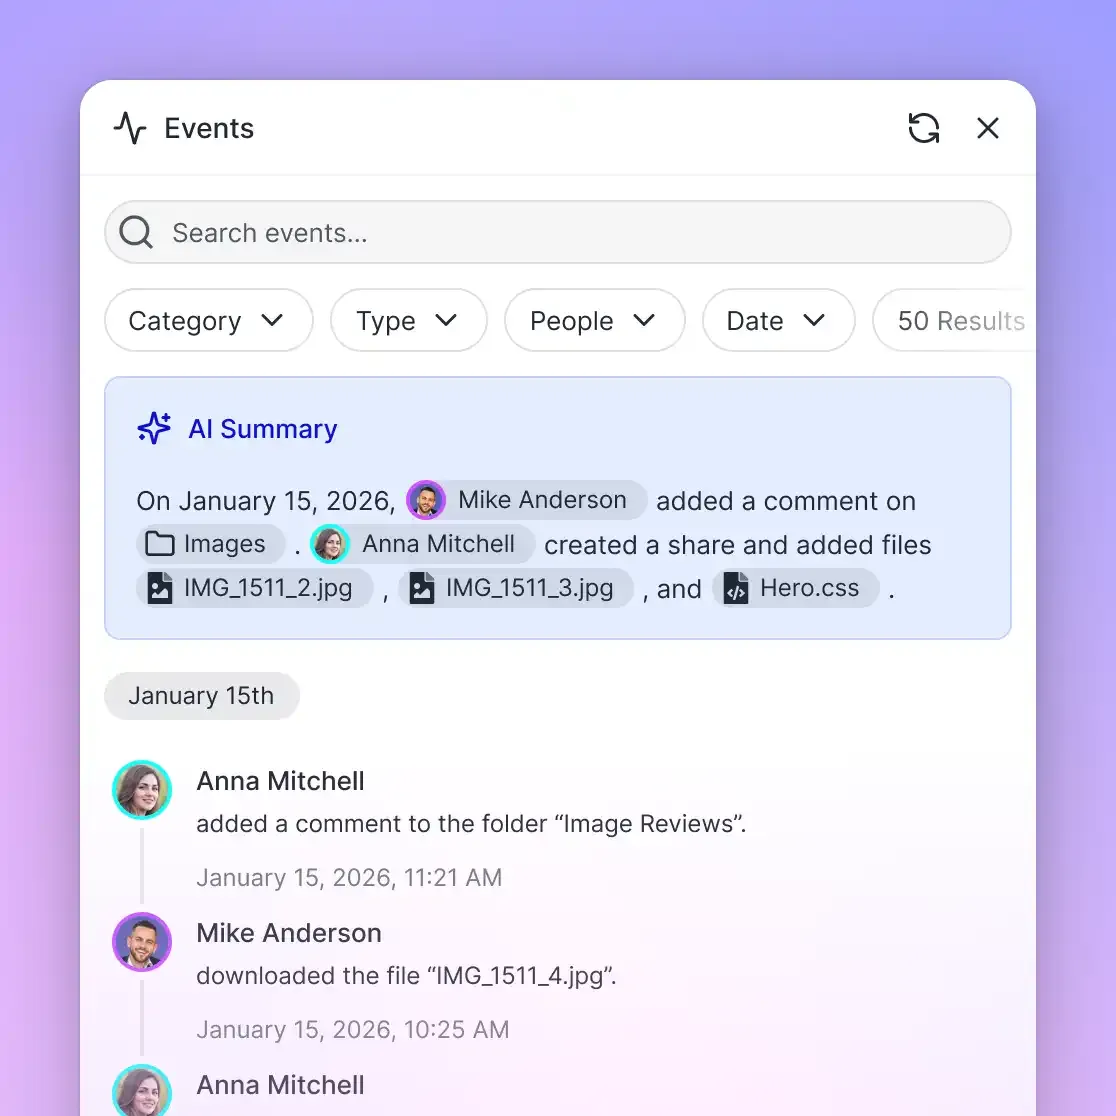
Integrated Intelligence Fast.io's Intelligence Mode indexes every file your agent creates. This means you can query the workspace itself: "Show me all files created by the 'InvoiceAgent' yesterday." This turns your storage layer into an active observability tool.
Frequently Asked Questions
What is the difference between LLM monitoring and agent observability?
LLM monitoring focuses on the model itself (tokens, latency, quality), while agent observability tracks the entire workflow, including tool calls, multi-step reasoning, and side effects like file creation.
What are the best tools for AI agent observability?
Top platforms include LangSmith, Arize Phoenix, and Braintrust for tracing execution chains. Fast.io complements these by providing observability into the file system and artifacts the agent produces.
How do I debug an agent that is stuck in a loop?
Use tracing tools to inspect the 'Chain of Thought' steps. Often, an agent loops because it receives an error message it doesn't understand. Observability allows you to see that specific error and adjust the prompt or tool definition.
Does Fast.io replace LangSmith?
No, they work together. LangSmith traces the agent's internal logic and API calls. Fast.io manages and logs the actual files, state, and outputs the agent generates, providing the 'environmental' view.
Related Resources

Run Master AI Agent Observability Logs Traces Metrics workflows on Fast.io
Stop guessing what your agents are doing. Use Fast.io to log, version, and index every file your agents create.