How to Implement Distributed Tracing for AI Agents
Distributed tracing for AI agents enables developers to track requests as they flow through complex multi-agent systems. By instrumenting agents with OpenTelemetry, you can visualize handoffs, debug non-deterministic behaviors, and optimize token usage across your entire fleet.
What is Distributed Tracing for AI Agents?
Distributed tracing for AI agents is the practice of tracking a request or task as it flows through multiple autonomous agents, capturing timing, tool calls, file operations, and LLM interactions across the entire execution chain. Unlike traditional monolithic monitoring, distributed tracing visualizes the causal relationship between disparate actions, allowing developers to see exactly how an initial user prompt cascades into a series of agent-to-agent handoffs and tool executions. The OpenTelemetry project provides the most widely adopted framework for this kind of instrumentation.
In modern AI architectures, a single task often triggers a complex web of interactions. An orchestration agent might delegate subtasks to a research agent, which then calls a coding agent, which finally triggers a review agent. Without distributed tracing, these interactions are "black boxes," making it nearly impossible to diagnose why a workflow failed or why it consumed excessive tokens. For a broader look at monitoring strategies, see our guide on AI agent observability.
Key Components of an Agent Trace:
- Trace ID: A unique identifier that tags the entire lifecycle of a user request.
- Spans: Individual units of work (e.g., "LLM Call", "Tool Execution", "File Write").
- Context Propagation: The mechanism that passes the Trace ID from one agent to the next, preserving the narrative thread.
- Attributes: Metadata attached to spans, such as model name, temperature, token count, and prompt content.

Why Multi-Agent Systems Are Hard to Debug
Debugging multi-agent systems presents unique challenges that traditional software debugging tools cannot address. The primary difficulty lies in the non-deterministic nature of LLMs combined with the distributed logic of autonomous agents. When an error occurs, it is rarely a simple stack trace failure; often, it is a semantic failure where an agent misunderstood a prompt or hallucinated a tool output, causing a cascade of errors downstream.
The Complexity of Agent Hops As systems scale, the number of interactions grows exponentially. Multi-agent systems often involve multiple agent hops per complex task, with each hop introducing latency and a potential point of failure. If the third agent in a chain creates a slightly inaccurate file, an agent further down the line might crash, but the root cause lies several steps back. Tracing allows you to rewind the tape and inspect the state at every hop.
Evidence and Benchmarks The impact of observability on developer velocity is measurable. Implementing distributed tracing reduces mean-time-to-debug in distributed AI systems. This efficiency is critical when paying for token usage, as rapid debugging prevents runaway costs from looping agents.


Give Your AI Agents Persistent Storage
Fast.io gives your agents a shared workspace with audit logs, webhooks, and 50GB of free storage for trace artifacts.
How to Instrument Your Agents with OpenTelemetry
OpenTelemetry (OTel) has emerged as the industry standard for instrumenting AI applications. It provides a vendor-neutral way to collect traces, metrics, and logs. Here is a step-by-step approach to instrumenting a Python-based agent workflow.
Step 1: Initialize the Tracer Provider Before your agents start, you must configure a Global Tracer Provider. This acts as the central hub that creates tracers and exports data to your observability backend (like Jaeger, Zipkin, or a commercial tool).
from opentelemetry import trace
from opentelemetry.sdk.trace import TracerProvider
from opentelemetry.sdk.trace.export import BatchSpanProcessor, ConsoleSpanExporter

provider = TracerProvider()
trace.set_tracer_provider(provider)
tracer = trace.get_tracer(__name__)

span_processor = BatchSpanProcessor(ConsoleSpanExporter())
provider.add_span_processor(span_processor)
Step 2: Create Spans for Agent Activities Wrap every significant operation in a "span". Do not just trace the top-level request. Create child spans for specific actions.
with tracer.start_as_current_span("agent_thought_process") as span:
    span.set_attribute("agent.name", "researcher_gpt")
    span.set_attribute("agent.goal", "summarize_document")

response = llm.generate(prompt)

span.set_attribute("gen_ai.usage.total_tokens", response.usage.total_tokens)
Step 3: Propagate Context Across Agents This is the most critical step. When Agent A sends a message to Agent B, it must inject the current active context (trace ID) into the message headers or metadata. Agent B must then extract this context and use it to start its own spans. If you fail to do this, you will see two disconnected traces instead of one continuous workflow.
Key Attributes to Capture in Agent Spans
A trace is only as useful as the data it carries. To make your traces queryable and actionable, you must enrich spans with semantic attributes. OpenTelemetry defines semantic conventions, but you should extend them for AI specificities.
Essential Attributes:
gen_ai.system: The provider (e.g., "openai", "anthropic").gen_ai.request.model: The specific model used (e.g., "claude-sonnet").gen_ai.usage.input_tokens: Cost accounting relies on tracking this per-span.gen_ai.usage.output_tokens: Critical for monitoring verbosity and cost.agent.name: The identity of the agent performing the work.agent.tool.name: The specific function being called (e.g., "fast_io_read_file").
By consistently logging these attributes, you can answer complex questions like "Which agent consumes the most tokens on expensive models?" or "How often does the 'Researcher' agent fail to parse a file?" For more on structured logging approaches, see our guide on AI agent production logging.
Common Tracing Patterns for AI Workflows
When instrumenting your agents, you will encounter recurring patterns that require specific tracing strategies. Recognizing these patterns helps in designing a cleaner span hierarchy.
The 'Chain of Thought' Pattern In this pattern, an agent reasons through a problem in steps. You should create a parent span for the "Reasoning" phase, with child spans for each step of the thought process. This allows you to visualize where the logic diverged if the final answer is incorrect.
The 'Tool Loop' Pattern Agents often enter a loop: Think -> Act -> Observe -> Think. Each iteration of this loop should be a distinct span. If an agent gets stuck in a loop (e.g., repeatedly trying to read a file that doesn't exist), the trace visualization will show a repetitive "comb" pattern, instantly signaling a stuck agent.
The 'Fan-Out/Fan-In' Pattern When an orchestrator spawns multiple sub-agents in parallel (fan-out) and then aggregates their results (fan-in), your trace should show multiple parallel bars originating from a single point. If one bar is longer than the others, it identifies the straggler slowing down the entire workflow.
Fast.io: The Observable Workspace for Agents
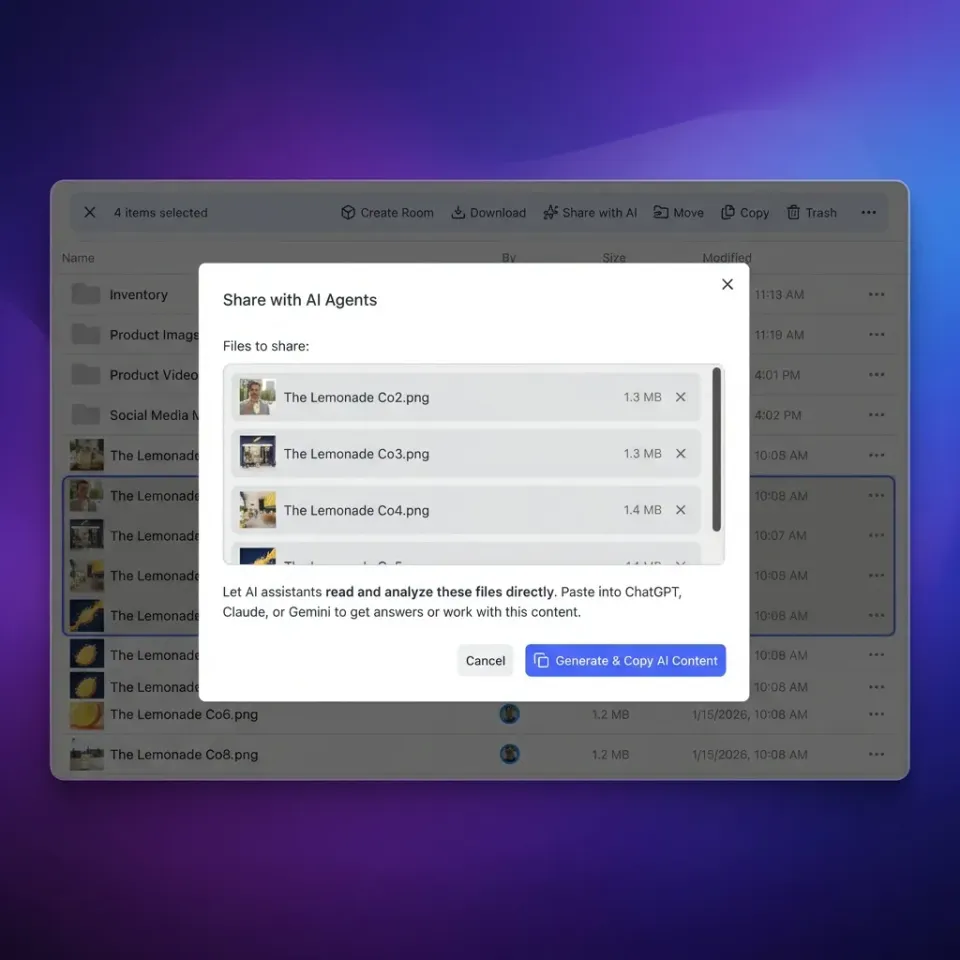
While OpenTelemetry handles the internal logic traces of your agents, Fast.io provides the infrastructure-level observability for the artifacts they create. Fast.io is designed as a shared workspace where humans and agents collaborate, offering native visibility into file operations and system events.
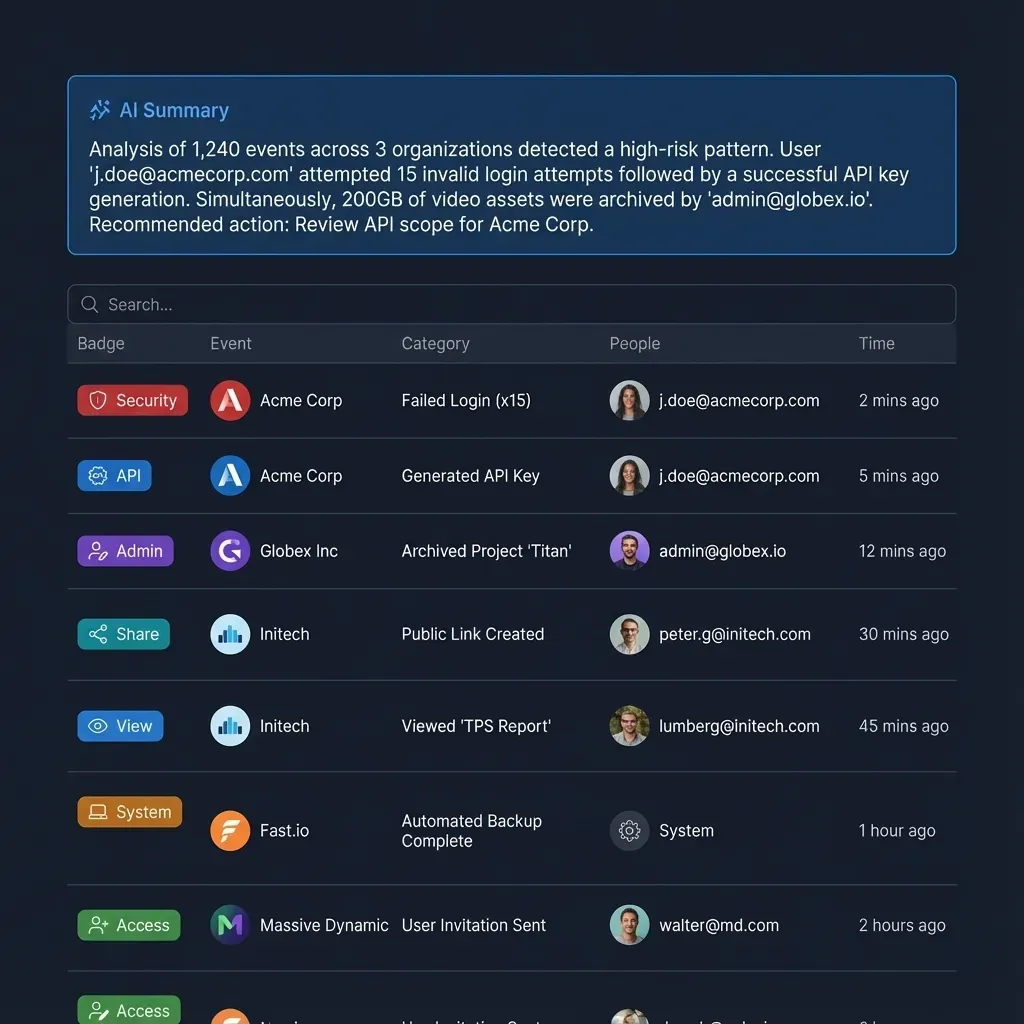
Audit Logs for File Operations When your agents create, modify, or delete files, Fast.io's audit logs provide a persistent, immutable record of these actions. This serves as a high-level check against your internal traces. If your trace says an agent wrote a file, but the Fast.io audit log shows no entry, you know the failure occurred at the network or permissions layer.
Reactive Workflows with Webhooks Fast.io supports granular webhooks that fire on file events. You can use these webhooks to trigger trace spans in your observability system. For example, when an agent uploads a final report, a Fast.io webhook can signal your tracing backend to close the parent trace, marking the workflow as successfully completed.
Centralized Storage for Trace Artifacts Agents often generate verbose logs, debug dumps, and intermediate state files. Fast.io offers a free agent tier with 50GB of storage, making it the ideal repository for these heavy artifacts. Instead of cluttering your production database with megabytes of JSON logs, have your agents offload full trace dumps to a Fast.io bucket, keeping your hot storage clean while ensuring deep debug data is always retrievable.
Frequently Asked Questions
What is the difference between logging and distributed tracing?
Logging records discrete events ('Error: File not found') at a specific point in time. Distributed tracing connects these events across multiple services, showing the path and timing of a request as it travels through the entire system.
Can I use OpenTelemetry with LangChain or AutoGen?
Yes, most modern AI frameworks like LangChain and LlamaIndex have built-in OpenTelemetry integrations. You can usually enable tracing with a single configuration flag or by wrapping your application in a provided callback handler.
How does tracing help with AI cost optimization?
By tagging every LLM call with token usage attributes, tracing allows you to visualize exactly where money is being spent. You can identify which agents are using expensive models unnecessarily or which prompts are generating excessive output.
What is the overhead of adding distributed tracing to agents?
The performance overhead is generally negligible (less than 1%) for the application itself. The primary cost is the storage and processing of the trace data, which can be managed by sampling traces or setting shorter retention periods.
Related Resources

Give Your AI Agents Persistent Storage
Fast.io gives your agents a shared workspace with audit logs, webhooks, and 50GB of free storage for trace artifacts.